Page 1 of 1
MULTICHARTS 8.5 BETA 2
Posted: Dec 29 2012
by admin
MultiCharts 8.5 Beta 2 has minor updates and fixes for features that were introduced in
Beta 1. It also has improved optimization process and dialog windows, and has a new data feed and broker connection from AvaTrade (formerly AvaFX).
Read more...
How to Migrate from MultiCharts 32 bit to MultiCharts 64 bit
https://www.multicharts.com/trading-sof ... rts_64_bit
Re: MULTICHARTS 8.5 BETA 2
Posted: Dec 29 2012
by swz168
Great! Thanks Multicharts Team for removing many bugfixes.
Just like to remind this (though it was already promised for the final release)

:
"Optimization settings should remain after editing the study":
https://www.multicharts.com/pm/viewissu ... no=MC-1207
Thanks a lot!
Re: MULTICHARTS 8.5 BETA 2
Posted: Dec 29 2012
by sptrader
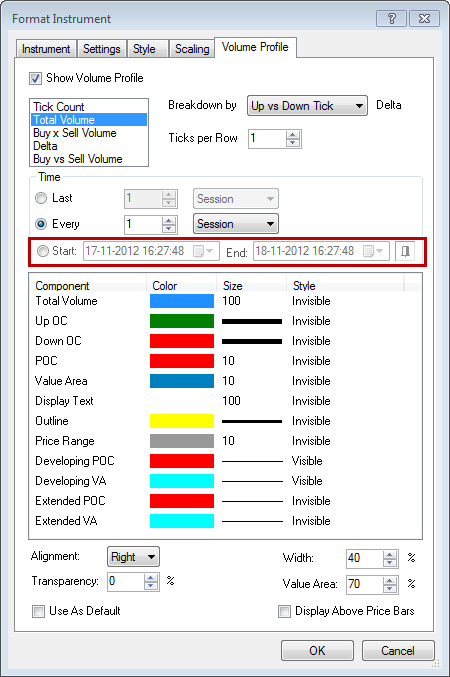
I just loaded beta2 and was looking at "volume profile" settings.. When I select "value area", "solid block", the result sometimes(not always) is multiple value areas, if I chose "Extended" I get the two correct values.
Is this a bug ?
Re: MULTICHARTS 8.5 BETA 2
Posted: Dec 29 2012
by arnie
I just loaded beta2 and was looking at "volume profile" settings.. When I select "value area", "solid block", the result sometimes(not always) is multiple value areas, if I chose "Extended" I get the two correct values.
Is this a bug ?
No, it's not a bug.
Just raise the Size to 100. You probably left it at 10, the default value.
Personally I would prefer, when set to Solid Blocks, the size be automatically set to 100 and the option become unavailable. If it's solid block there's no need to have the size option available.
This might create some confusion as we just seen.
Re: MULTICHARTS 8.5 BETA 2
Posted: Dec 29 2012
by arnie
I'd like to make a request.
Please add in the Keyboard Shortcuts Show HL bars.
Also add Show Invisible bars. This way we can easily toggle between make bars visible, make bars invisible.
Thanks.
Fernando
Re: MULTICHARTS 8.5 BETA 2
Posted: Dec 30 2012
by SP
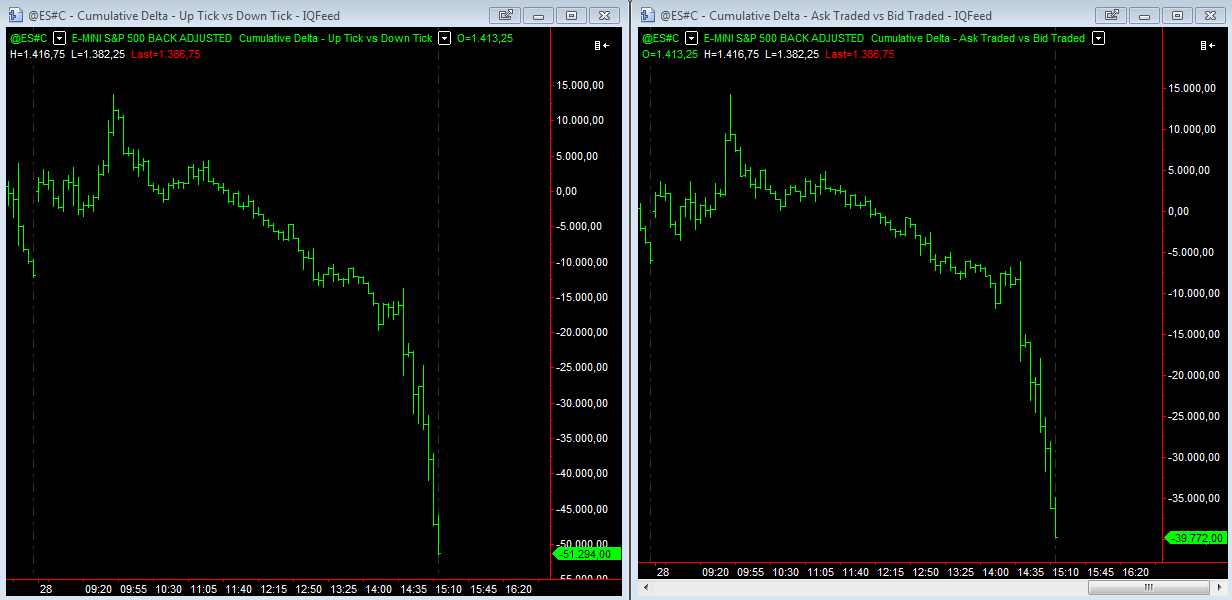
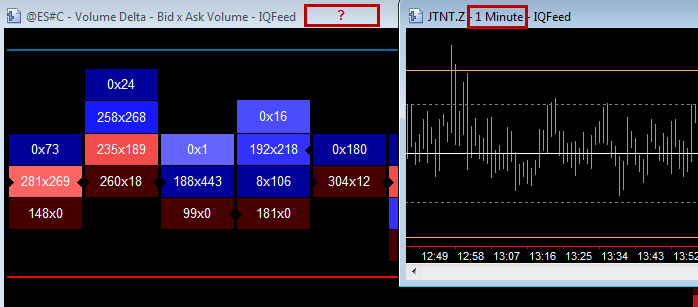
If i open with beta 2 and IQFeed two Cumulative Delta charts (1 set to Uptick vs Downtick and the other to Ask vs Bid ) i get exactly the same result which cant be the case due to the different calculation. The same is true for Volume Delta charts.
The beta 1 shows correctly different values for both charts. It seems that on historical data beta 2 only returns uptick/downticks for bid vs ask.
With Interactive as data source i get the correct different values for both calculation methods.
Could someone with IQfeed confirm that behavior and the difference to beta 1 ?
Re: MULTICHARTS 8.5 BETA 2
Posted: Dec 30 2012
by arnie
If i open with beta 2 and IQFeed two Cumulative Delta charts (1 set to Uptick vs Downtick and the other to Ask vs Bid ) i get exactly the same result which cant be the case due to the different calculation. The same is true for Volume Delta charts.
The beta 1 shows correctly different values for both charts. It seems that on historical data beta 2 only returns uptick/downticks for bid vs ask.
With Interactive as data source i get the correct different values for both calculation methods.
Could someone with IQfeed confirm that behavior and the difference to beta 1 ?
That's strange.
All seems to be correct here.
Re: MULTICHARTS 8.5 BETA 2
Posted: Dec 30 2012
by SP
With @ES#C i get the same results as you with different values, but with @ES# they are the same values for both calculations.
PS: Ok, reloading the complete history with Reload All Data solved it. Now the values are correct.
Re: MULTICHARTS 8.5 BETA 2
Posted: Dec 30 2012
by arnie
With @ES#C i get the same results as you with different values, but with @ES# they are the same values for both calculations.
If you can, delete the data and download new one.
Beta 2 "manages" IQFeed data differently now.
Delta calculations are now more accurate.
Re: MULTICHARTS 8.5 BETA 2
Posted: Jan 01 2013
by MC_Prog
Hi.
re: Optimization dialog window now shows current best results during optimization.
I seem to be only observing this during a Genetic Optimization, but not during an Exhaustive Optimization.
Re: MULTICHARTS 8.5 BETA 2
Posted: Jan 02 2013
by Chi-Yuan Shih
After upgrade from beta1x64 to beta2x64, Multicharts failed to get realtime data from GlobalServer.
I try to totally remove beta1 then reinstall beta2. The errors are still there, and keep sengding out error reports.
[ You should have received them]
It seems that there is a bug in Globalserver data feed.
Please check it, many TKS !
Re: MULTICHARTS 8.5 BETA 2
Posted: Jan 02 2013
by swz168
Multicurrency Support is according to PM targeted for MC 8.5 Beta2 (
https://www.multicharts.com/pm/viewissu ... _no=MC-925 ). I can't see in Beta2 a full implementation for Multicurrency support. Right now there is only an addition in "order and postion tracker".
Please offer Multicurrency support for
- Performance Report and all other reports inside a chart
- All reports in Portfolio backtester
This is essential for Forex and markets with different currencies.
Thanks!
Re: MULTICHARTS 8.5 BETA 2
Posted: Jan 02 2013
by MC_Prog
For MultiCharts Version 8.5 Beta 2 (Build 6528) 64b running under Win8 I notice that the orange/green/blue MC ring icon does not appear in the task bar when the program runs. I see only a blank square.
Re: MULTICHARTS 8.5 BETA 2
Posted: Jan 02 2013
by Dave Masalov
Hi.
re: Optimization dialog window now shows current best results during optimization.
I seem to be only observing this during a Genetic Optimization, but not during an Exhaustive Optimization.
For Exhaustive algorithm, you need to have the "Use limitation" check-box checked on the Optimization Criteria tab to select the criteria. See attached screenshot.
Re: MULTICHARTS 8.5 BETA 2
Posted: Jan 02 2013
by Smoky
i would like true replay, tick by tick with renko charts not brick by brick ....it's ok now, with this beta ?
Re: MULTICHARTS 8.5 BETA 2
Posted: Jan 02 2013
by MC_Prog
Hi.
I'm pretty sure there is something wrong with the Optimizer in relation to a) the check box, b) the current value, c) the start/end/step values, d) what the optimizer actually iterates over or tests.
I have a strategy here (sorry I cannot supply it) where I'm iterating over stops and targets and getting no difference in outcome.
Another observation is that when using the optimizer to sweep some parameters over a set which includes a particular well-performing iteration, that iteration is not found in the results. Yet, if I type those params in by hand in the signal format window I again get the well-performing result.
I realize it would be most helpful if I could provide you an exact set of replicable steps, and I'm sorry I can't at this moment. However, after some hours of working on this, I'm pretty sure something is not right and engineering will need to revisit this.
Re: MULTICHARTS 8.5 BETA 2
Posted: Jan 02 2013
by MC_Prog
Re: the new Exhaustive Search Properties dialog check boxes -
When a box is unchecked, is it the Current Value, Start Value, or End Value which we should expect the optimizer to use for that item?
Do I understand correctly that the Current Value is not intended to be settable from within the Exhaustive Search Properties dialog, but is always carried over from the Format Signal dialog?
BTW, it would be VERY helpful to be able to turn all the checkboxes on or off at once.
Re: MULTICHARTS 8.5 BETA 2
Posted: Jan 02 2013
by swz168
Optimizer Input Problems
Here German System ( where decimal mark is a comma, not a dot)
Exhaustive Optimization:
Input1: (comma!)
Start= 21,0
End= 22,0
Step=0,1
Step Count = 11
---
Input1:
Start= 21.0 (dot)
End= 22.0 (dot)
Step=0,1 (comma!)
Step Count = 101
---
Input1:
Start= 21.0 (dot)
End= 22.00 (dot)
Step=0,1 (comma!)
Step Count = 19901
---
Input1:
Start= 21
End= 22
Step=0.1 (dot!)
Step Count = 2
---
Conclusion: The dot is ignored in systems where the decimal mark is a comma.
Since in programming you use dot as decimal mark (no matter what decimal mark system you have in your country), it makes sence, that you can input dot as decimal separator in optimizer!
So currently two decimal system is in use (eg. in German System PowerLanguage: dot, Input Window: Comma). Please unify the systems all to dot system! Otherwise it is very confusing. At least the system should be intelligent enough to recognize 0.1 as 0,1 and not 1 (see above last example)
Edit: If I start the optimization, it seems Multicharts does everything correct (in all cases 11 step counts). So it is just the numbers shown before the actual optimization is wrong.
Re: MULTICHARTS 8.5 BETA 2
Posted: Jan 03 2013
by Dave Masalov
Hi.
I'm pretty sure there is something wrong with the Optimizer in relation to a) the check box, b) the current value, c) the start/end/step values, d) what the optimizer actually iterates over or tests.
I have a strategy here (sorry I cannot supply it) where I'm iterating over stops and targets and getting no difference in outcome.
Another observation is that when using the optimizer to sweep some parameters over a set which includes a particular well-performing iteration, that iteration is not found in the results. Yet, if I type those params in by hand in the signal format window I again get the well-performing result.
I realize it would be most helpful if I could provide you an exact set of replicable steps, and I'm sorry I can't at this moment. However, after some hours of working on this, I'm pretty sure something is not right and engineering will need to revisit this.
Hello MC_Prog,
To investigate this issue we do need the signal you use as well as the description of steps to reproduce the issue. A video showing the issue would help too. Have you tried to reproduce the issue with a default signal?
Re: MULTICHARTS 8.5 BETA 2
Posted: Jan 03 2013
by Dave Masalov
Re: the new Exhaustive Search Properties dialog check boxes -
When a box is unchecked, is it the Current Value, Start Value, or End Value which we should expect the optimizer to use for that item?
If check box is unchecked the current value will be used.
Do I understand correctly that the Current Value is not intended to be settable from within the Exhaustive Search Properties dialog, but is always carried over from the Format Signal dialog?
You are correct.
BTW, it would be VERY helpful to be able to turn all the checkboxes on or off at once
Your suggestion has been forwarded to the developers and will be considered for future implementation.
Re: MULTICHARTS 8.5 BETA 2
Posted: Jan 03 2013
by Dave Masalov
Optimizer Input Problems
Hello swz168,
Thank you for your feedback. Your request has been forwarded to the developers.
Re: MULTICHARTS 8.5 BETA 2
Posted: Jan 03 2013
by Nick
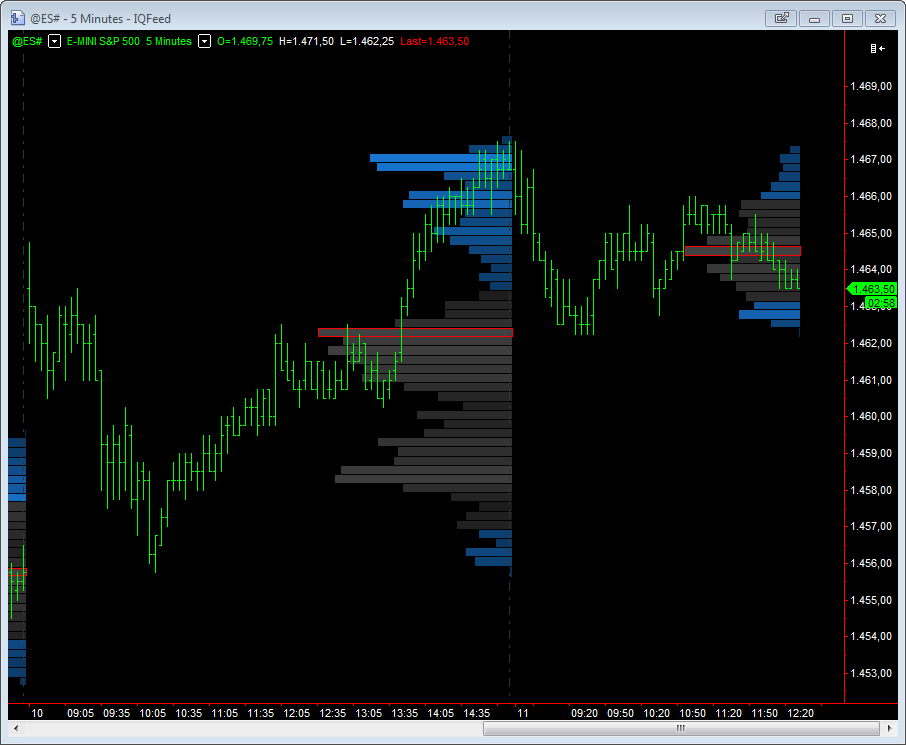
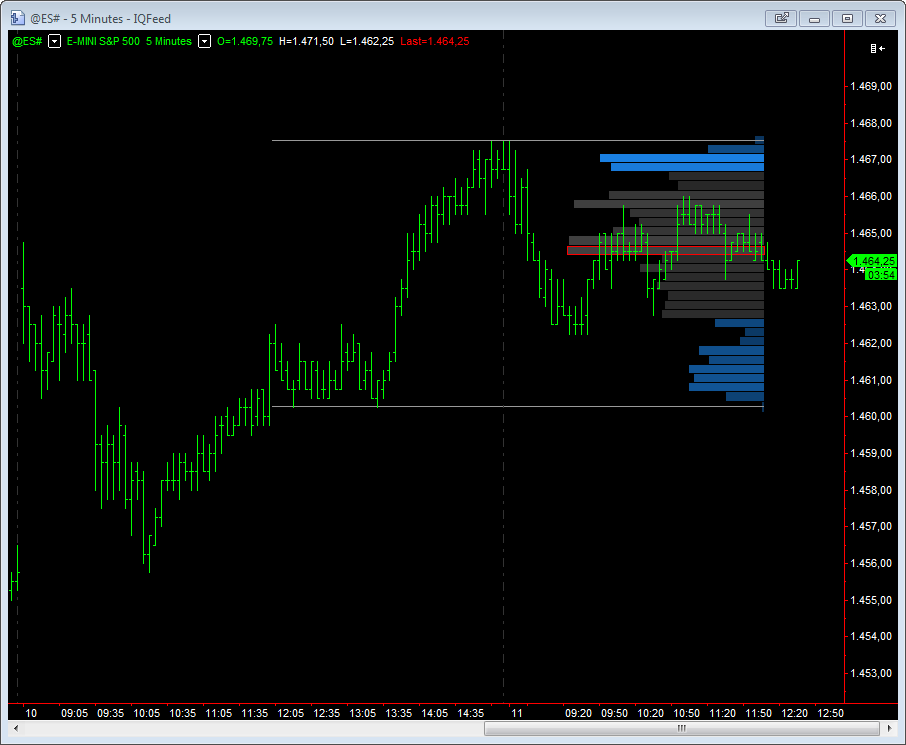
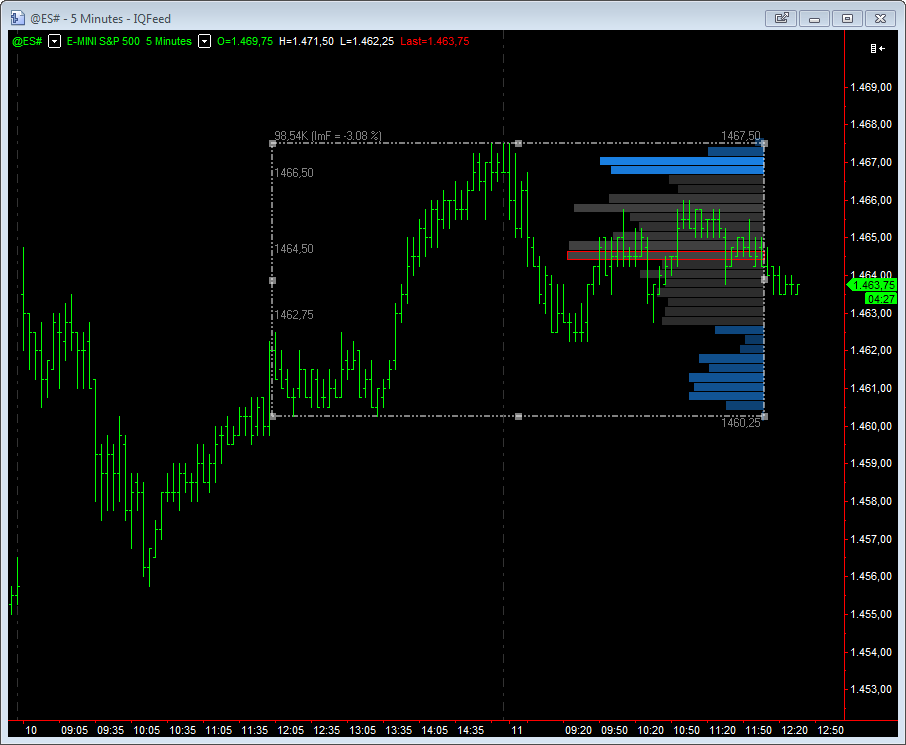
Am I right in thinking that you can only have 1 profile per chart? (even though that can be reset every session/bar/week). Personally I think 'dynamic' profiles are far more useful (where you define the start point and end point). However you really need to be able to ave more than one of these on a chart.
Perhaps and example would illustrate better. The attached image shows a chart with a rectangle representing previous support and a rectangle representing previous resistance. I would like to draw a profile of each area to show where value and poc for these areas was. They are great locations to trade against.
Ideally I would like to be able to do this for numerous areas on a chart. I guess a work around would be to generate a profile then draw lines representing value and poc the redefine the profile to the next are you are interested in.
Re: MULTICHARTS 8.5 BETA 2
Posted: Jan 03 2013
by arnie
Am I right in thinking that you can only have 1 profile per chart? (even though that can be reset every session/bar/week). Personally I think 'dynamic' profiles are far more useful (where you define the start point and end point). However you really need to be able to ave more than one of these on a chart.
Perhaps and example would illustrate better. The attached image shows a chart with a rectangle representing previous support and a rectangle representing previous resistance. I would like to draw a profile of each area to show where value and poc for these areas was. They are great locations to trade against.
Ideally I would like to be able to do this for numerous areas on a chart. I guess a work around would be to generate a profile then draw lines representing value and poc the redefine the profile to the next are you are interested in.
Check this:
Also, to have multiple profiles you need to overlay multiple data series.
Re: MULTICHARTS 8.5 BETA 2
Posted: Jan 03 2013
by Nick
Thanks Arnie I was aware of that. The question was really in regards to having multiple profiles per chart. Multiple data series would be one workaround for sure though somewhat cumbersome.
Re: MULTICHARTS 8.5 BETA 2
Posted: Jan 03 2013
by Nick
Well after banging on about precision and accuracy I'm going to suggest something that goes against all that!
When loading profiles that go back days weeks or even months it obviously takes an age to generate the profile! (I have had one that is only 30 days long and that has been at it for hours). The interesting thing is with these profiles tick level accuracy is not required as everything is so much larger.
It would be useful to have the option to build profiles from
minute data rather than tick data, that is plenty accurate enough for these larger profiles. The important thing is that the volume should be averaged equally from low to high of the period used for the approximation. It would be good to have this as an option for any sort of profile really.
Re: MULTICHARTS 8.5 BETA 2
Posted: Jan 03 2013
by arnie
Thanks Arnie I was aware of that. The question was really in regards to having multiple profiles per chart. Multiple data series would be one workaround for sure though somewhat cumbersome.
For your needs, the best would be a manual profile drawing tool.
I'm sure this will be offered sooner or later, I hope. Maybe for version 10 (fingers crossed) since version 9 will be all about portfolio auto-trading.
Re: MULTICHARTS 8.5 BETA 2
Posted: Jan 04 2013
by Nick
Thanks Arnie I was aware of that. The question was really in regards to having multiple profiles per chart. Multiple data series would be one workaround for sure though somewhat cumbersome.
For your needs, the best would be a manual profile drawing tool.
I'm sure this will be offered sooner or later, I hope. Maybe for version 10 (fingers crossed) since version 9 will be all about portfolio auto-trading.
Yes definitely! IRT has a good implementation (don't use it myself but have seen it). You select profile and then simply click and drag to select the range of bars you want to profile.
What is intresting is that it draws the profile dynamically updating it as you drag the selection. I wonder if they maintain a table of data@price in the database as the data is received to allow speed of calculation.
Re: MULTICHARTS 8.5 BETA 2
Posted: Jan 04 2013
by arnie
Yes definitely! IRT has a good implementation (don't use it myself but have seen it). You select profile and then simply click and drag to select the range of bars you want to profile.
What is intresting is that it draws the profile dynamically updating it as you drag the selection. I wonder if they maintain a table of data@price in the database as the data is received to allow speed of calculation.
I really don't know how IRT manage their database but their profiles are built in 2 ways, minute and tick data.
You're able to select how many days of tick and minute data you want separately.
So you decide to have 1000 days of minute data loaded and only 10 days of tick data. The 10 days of tick data will be the most recent days and the 11th day backwards will be minute data. This assumes that the most important days for you are the last 10 days and these are the ones that should have a more accurate volume reading, hence the tick data. This allows you to have years of profiles/composites loaded easily and fast.
This has been mentioned on the beta 1 thread. When the tick data starts to build and instead of the standard 120 days that IQFeed offers you have more than a year on QM it will be interesting to see how will MC handle such a task of managing profiles for that period. This should be another area where you will see sooner or later some movement because users will start to complain the time it takes to load such charts.
For now 120 days are handled pretty fast (despite the time it takes to download such period the first time).
Re: MULTICHARTS 8.5 BETA 2
Posted: Jan 04 2013
by swz168
Multicurrency Support is according to PM targeted for MC 8.5 Beta2 (
https://www.multicharts.com/pm/viewissu ... _no=MC-925 ). I can't see in Beta2 a full implementation for Multicurrency support. Right now there is only an addition in "order and postion tracker".
Please offer Multicurrency support for
- Performance Report and all other reports inside a chart
- All reports in Portfolio backtester
This is essential for Forex and markets with different currencies.
Thanks!
In PM you have confirmed that right now only Order and Postion tracker has Multicurrency.
Please implement Multicurrency also for reports. This is very important.
E.g.:
If you trade
EUR/USD -> Profit and Loss is in USD
USD/CAD -> Profit and Loss is in CAD
USD/JPY -> Profit and Loss is in JPY
Now if you do a Portfolio backtest/optimiziation, the result is useless since the result are just summed up.
This is not only important for Forex, but for all kind of markets. E.g. I want to backtest a portfolio with ES and DAX (USD and EUR currency!), the result is useless!
There must be a possibility that we can define in what currency we want to see the results of the reports. Sadly we cannot make full use of the great capability of the portfolio backtester/optimizer yet!
This is also essential for your big project this year: portfolio trading!
Edit:
I know as a workaround you could use the Bigpoint Value settings. But this has also it's limitation. And the limitations (only one fixed exchange rate) is even worsened by the fact, that you can only input two decimal places, making the workaround hardly usable.
Since real Multicurrency takes more time to implement, you could for now make the workaround more useable by allowing more than two decimal. This should be implemented fast.
See also:
https://www.multicharts.com/pm/viewissu ... _no=MC-314
viewtopic.php?f=1&t=11260&p=55678&hilit ... lue#p55678
Again, this is not only a forex market problem, but a problem for every trader who trades different markets with different currencies involved.
Re: MULTICHARTS 8.5 BETA 2
Posted: Jan 04 2013
by ABC
This has been mentioned on the beta 1 thread. When the tick data starts to build and instead of the standard 120 days that IQFeed offers you have more than a year on QM it will be interesting to see how will MC handle such a task of managing profiles for that period. This should be another area where you will see sooner or later some movement because users will start to complain the time it takes to load such charts.
For now 120 days are handled pretty fast (despite the time it takes to download such period the first time).
The only pity is, when using back adjusted contract data (like IQs @ES#C), currently you will never be able to use more than 120 days of tick data. As with every contract change, the stored data will not be back adjusted automatically, so you have to reload it manually.
I have not tested how MC handles custom continuous contracts build from the individual contracts when it comes to profiles, but currently this seems the only choice we have to work with longer tick data histories and correctly back adjustment.
We'd need a database tool to adjust the old @ES#C tick data at every rollover.
Regards,
ABC
Re: MULTICHARTS 8.5 BETA 2
Posted: Jan 04 2013
by arnie
The only pity is, when using back adjusted contract data (like IQs @ES#C), currently you will never be able to use more than 120 days of tick data. As with every contract change, the stored data will not be back adjusted automatically, so you have to reload it manually.
I have not tested how MC handles custom continuous contracts build from the individual contracts when it comes to profiles, but currently this seems the only choice we have to work with longer tick data histories and correctly back adjustment.
We'd need a database tool to adjust the old @ES#C tick data at every rollover.
Regards,
ABC
You've raised a very, very important point ABC.
Since @ES#C symbol is back-adjusted it will never be updated when a new contract is added. I could saw this first hand when March contract became the active one. You would need in fact to download/reload data.
I also never tested MC's custom continuous contracts, maybe this can be handled through it?
IRT actually have a built in tool which back adjusts the continuous contracts automatically. That's why most people use the @ES# contract instead of the @ES#C. IRT back-adjusts it.
It's of the utmost importance to find a solution for this.
QM needs to have an option so continuous contracts can be back-adjusted, otherwise we will never have more than 120 days of data.
Re: MULTICHARTS 8.5 BETA 2
Posted: Jan 04 2013
by SP
Dave,
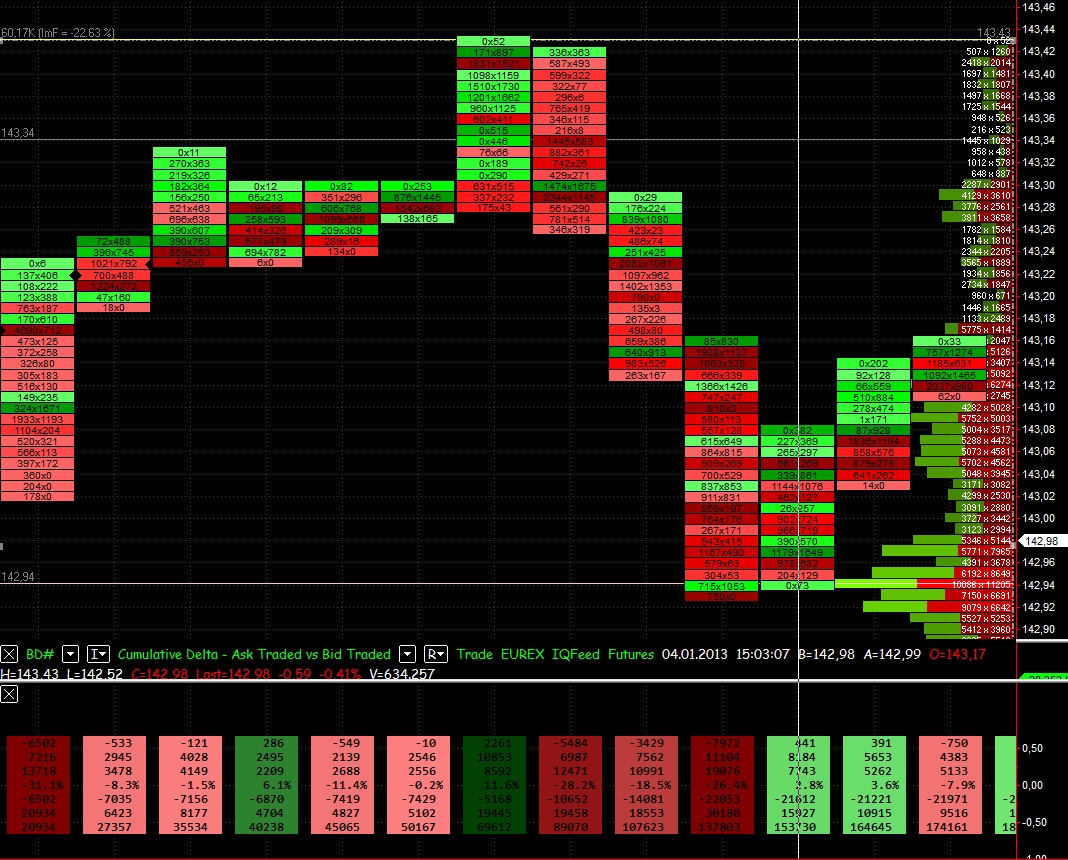
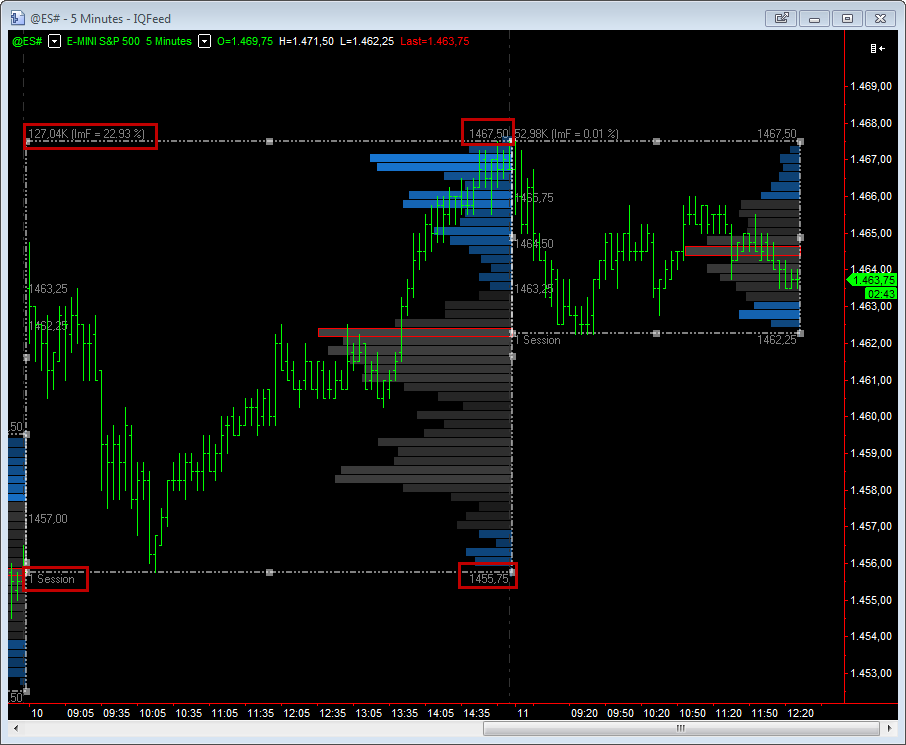
what does the number on the upper left on a volume profile mean, i.e. 60,17K (lmF -22,63%) ?
Re: MULTICHARTS 8.5 BETA 2
Posted: Jan 04 2013
by Dave Masalov
It's of the utmost importance to find a solution for this.
QM needs to have an option so continuous contracts can be back-adjusted, otherwise we will never have more than 120 days of data.
Arnie, ABC,
What you describe should be fairly easily accomplished using Custom Futures feature in MultiCharts:
https://www.multicharts.com/trading-sof ... om_Futures
Re: MULTICHARTS 8.5 BETA 2
Posted: Jan 04 2013
by Dave Masalov
Dave,
what does the number on the upper left on a volume profile mean, i.e. 60,17K (lmF -22,63%) ?
Hello SP,
60,17K is Total Volume
lmF -22,63% is Imbalance factor.
The Imbalance factor is calculated by taking the difference between the percent of volume above the POC and subtracting the percent of volume below the POC. Imbalance factor = -22,63% means that 22,63% more volume traded below the POC than above the POC within current profile.
Re: MULTICHARTS 8.5 BETA 2
Posted: Jan 04 2013
by ABC
It's of the utmost importance to find a solution for this.
QM needs to have an option so continuous contracts can be back-adjusted, otherwise we will never have more than 120 days of data.
Arnie, ABC,
What you describe should be fairly easily accomplished using Custom Futures feature in MultiCharts:
https://www.multicharts.com/trading-sof ... om_Futures
Thanks Dave. I just checked the link you provided and to use the full potential of the custom futures, the limitations would need to be lifted. When will you get rid of the following
Custom Futures limitations?
The resolutions available for Custom Futures are 1 Day and lower (tick, point, contract, change, second, minute).
Only the Regular Chart type is available for custom futures.
Bar Magnifier Mode is not available for Custom Futures.
DataPlayback for Custom Futures can be used in “As Is” mode only.
Thank you,
ABC
Re: MULTICHARTS 8.5 BETA 2
Posted: Jan 04 2013
by arnie
It's of the utmost importance to find a solution for this.
QM needs to have an option so continuous contracts can be back-adjusted, otherwise we will never have more than 120 days of data.
Arnie, ABC,
What you describe should be fairly easily accomplished using Custom Futures feature in MultiCharts:
https://www.multicharts.com/trading-sof ... om_Futures
Unfortunately Custom Futures is something that we cannot use since it does not support volume profile.
This should be something simple as picking the symbol we want, open its settings and select an option where we could have the time to select the rollover and the back-adjustment settings. From that point on, that symbol, that data, would be back-adjusted every single time a new contract would be added.
Theoretical, when moving historical prices up or down according to the adjustment ratio, volume, being aggregated to price, should follow it.
So if prices after the adjustment raises 6 pts, from 1400 to 1406 and if at 1400 we had 56200 contracts traded, after prices being adjusted, now at 1406, we should have the same 56200 contracts. This would allow us to have access to volume profile and delta. Actually, it's really not an option not having access to volume profile and delta.
Re: MULTICHARTS 8.5 BETA 2
Posted: Jan 04 2013
by jl12
Hello SP
I am interested to see that you have a statistical breakdown of the delta below the chart, are the values for Buy and Sell Volume available as callable functions.
Hello SP
Re: MULTICHARTS 8.5 BETA 2
Posted: Jan 04 2013
by SP
jl12,
you could get the values with the formula here on Cumulative Delta charts:
viewtopic.php?f=1&t=11339#p56296
Re: MULTICHARTS 8.5 BETA 2
Posted: Jan 05 2013
by Spaceant
Where can I download the beta? I can't see the link!
Re: MULTICHARTS 8.5 BETA 2
Posted: Jan 05 2013
by arnie
Re: MULTICHARTS 8.5 BETA 2
Posted: Jan 05 2013
by MC_Prog
Hi.
I'm pretty sure there is something wrong with the Optimizer in relation to a) the check box, b) the current value, c) the start/end/step values, d) what the optimizer actually iterates over or tests.
I have a strategy here (sorry I cannot supply it) where I'm iterating over stops and targets and getting no difference in outcome.
Another observation is that when using the optimizer to sweep some parameters over a set which includes a particular well-performing iteration, that iteration is not found in the results. Yet, if I type those params in by hand in the signal format window I again get the well-performing result.
I realize it would be most helpful if I could provide you an exact set of replicable steps, and I'm sorry I can't at this moment. However, after some hours of working on this, I'm pretty sure something is not right and engineering will need to revisit this.
Today I very carefully observed and then went thru a sequence of steps to produce the attached Word document.
This document proves (I believe) the existence of a bug. (It's also as much as I can do about this personally right now.)
I very much hope this is fixed in Beta3, as the new optimization configuration and save/reload capabilities will be a superb addition to MC once they are working correctly and reliably.
P.S. I have entered this in PM as MC-1208 - Optimizer changes values when not instructed to do so
Re: MULTICHARTS 8.5 BETA 2
Posted: Jan 06 2013
by seandean
I just upgraded from 8.0.5622 to 8.5.6525 Beta 2, I appreciate the new features and improvements.
I’m noticing that the slippage calculation is not being displayed in the Strategy Performance Report, even though one has been set in the appropriate field under Strategy Properties. This was working before I made the upgrade.
This applies to my charts automatically saved from the previous version, and also the new charts created in the beta.
Is this a known bug, can anyone else confirm or deny?
Thanks.
Re: MULTICHARTS 8.5 BETA 2
Posted: Jan 07 2013
by SP
- As volume delta charts are able to plot subseconds text, boxes/rectangles, colors, is there a possibility to make this feature availible for all PLE indictors ? At the moment we are limited to seconds which makes it very dificult to plot text on fast tick charts as some text gets plot on the
same bar instead of every bar.
- Add one more check box for Cumulative Delta charts to plot the MD per bar, not only per Session.
Apart from that the improvements are great.
Re: MULTICHARTS 8.5 BETA 2
Posted: Jan 07 2013
by Dave Masalov
I just upgraded from 8.0.5622 to 8.5.6525 Beta 2, I appreciate the new features and improvements.
I’m noticing that the slippage calculation is not being displayed in the Strategy Performance Report, even though one has been set in the appropriate field under Strategy Properties. This was working before I made the upgrade.
This applies to my charts automatically saved from the previous version, and also the new charts created in the beta.
Is this a known bug, can anyone else confirm or deny?
Thanks.
Hello seandean,
Slippage settings are not taken into account for limit orders in 8.5 Beta 2. This is expected behavior.
Re: MULTICHARTS 8.5 BETA 2
Posted: Jan 08 2013
by Nick
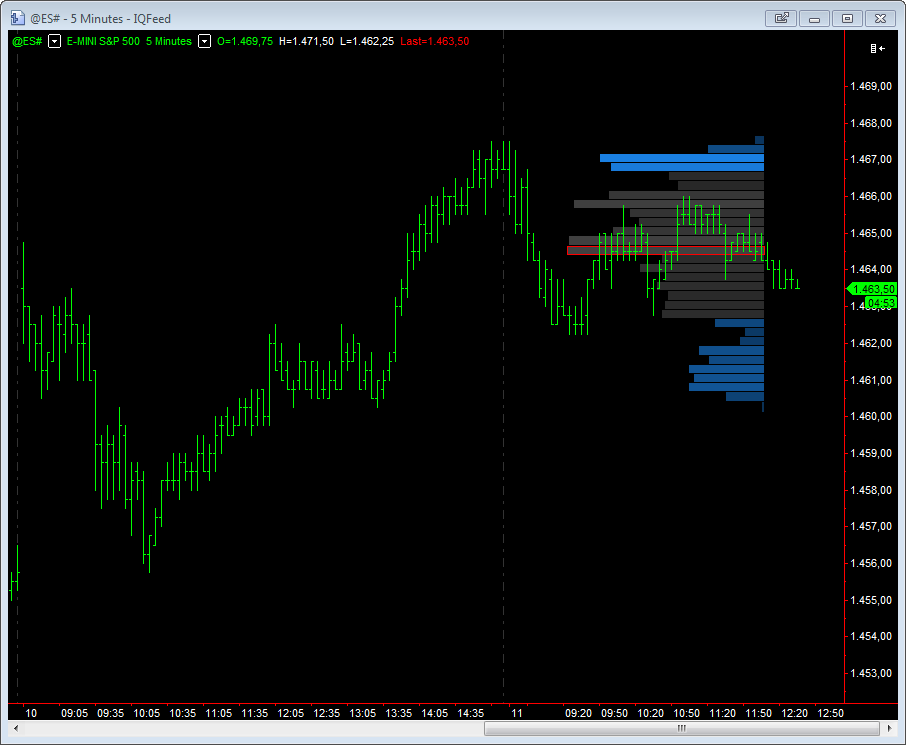
Extended Value Area (blue line) should start plotting in the next session not in the current session. It makes the display confusing where it clashes with the current value area (grey wide line). Same with extended PoC (I didnt show that as the display became too confusing!)
Note there also appears to be a small buggette. The extended value VAL just seems to stop plotting.
Re: MULTICHARTS 8.5 BETA 2
Posted: Jan 08 2013
by Nick
Well after banging on about precision and accuracy I'm going to suggest something that goes against all that!
When loading profiles that go back days weeks or even months it obviously takes an age to generate the profile! (I have had one that is only 30 days long and that has been at it for hours). The interesting thing is with these profiles tick level accuracy is not required as everything is so much larger.
It would be useful to have the option to build profiles from
minute data rather than tick data, that is plenty accurate enough for these larger profiles. The important thing is that the volume should be averaged equally from low to high of the period used for the approximation. It would be good to have this as an option for any sort of profile really.
On reflection I think this is a
must have. If you refresh a weekly chart (lets say) with a profile from the beggining of last year (not an unreasonable thing for a 'big picture' chart). Multicharts will go off and try and download a years worth of tick data. (Actually could be several). Imho larger/higher time frame/longer in the past profiles should be built from minute data. Tick precision is not required when looking at days of profile and millions of contracts.
I would suggest daily and above charts built from minute data. Intraday time frames still built from tick.
Re: MULTICHARTS 8.5 BETA 2
Posted: Jan 08 2013
by arnie
Extended Value Area (blue line) should start plotting in the next session not in the current session. It makes the display confusing where it clashes with the current value area (grey wide line). Same with extended PoC (I didnt show that as the display became too confusing!)
Note there also appears to be a small buggette. The extended value VAL just seems to stop plotting.
I believe you're confusing things here.
Extended VA and POC are being extended till future intersection.
As soon one of the lines are crossed up or down that line will stop being plotted. It was crossed, it's no longer "naked".
Also, if you're extending the lines they should extended from here they start, which is today profile. It makes no sense starting to extend today's lines on tomorrow's session because a person looking at such chart his first thought would be those lines are from today and not yesterday.
Re: MULTICHARTS 8.5 BETA 2
Posted: Jan 08 2013
by arnie
I would suggest daily and above charts built from minute data. Intraday time frames still built from tick.
This would originate a problem when you generate your daily bar from minute data.
Considering minute charts your intraday time frames, every time you request a 405 minute bar which is the total period for the RTH session for ES you would be using tick data. So if you request a 2 year profile based on the RTH period you are downloading tick data since there's no other way to create a daily bar for that period.
I believe IRT's way is the best way, you select how many days of tick data you want, which will be the most recent days and everything prior to that will be minute based.
The question here is more if MC's database structure allows to differentiate this type of data download, X data will be tick and X data will be minute.
Re: MULTICHARTS 8.5 BETA 2
Posted: Jan 08 2013
by swz168
Optimizer Input Problems
...
CRITICAL!
Another Problem related to decimal system where decimal seperator is a comma:
E.g.
In Strategy code:
Input: RISK (0.05), ....
Now when I start optimizing the strategy leaving RISK unchanged, that means start and end value not changed -> Step=1
Only other parameters are changed. Instead of 0.05, MC applies 5 for the value of risk. Please fix it.
Edit: Only in Optimizer!
Re: MULTICHARTS 8.5 BETA 2
Posted: Jan 08 2013
by Nick
Extended Value Area (blue line) should start plotting in the next session not in the current session. It makes the display confusing where it clashes with the current value area (grey wide line). Same with extended PoC (I didnt show that as the display became too confusing!)
Note there also appears to be a small buggette. The extended value VAL just seems to stop plotting.
I believe you're confusing things here.
Extended VA and POC are being extended till future intersection.
As soon one of the lines are crossed up or down that line will stop being plotted. It was crossed, it's no longer "naked".
Also, if you're extending the lines they should extended from here they start, which is today profile. It makes no sense starting to extend today's lines on tomorrow's session because a person looking at such chart his first thought would be those lines are from today and not yesterday.
Ahh OK so I am. They perhaps should be labeled naked or virgin rather than extended? There is a plot option I use on my indicators which is plot yesterday's VA/PoC today (only). I wonder if you can do that with MC implementation, I'll have to have another mess around tomorrow.
Re: MULTICHARTS 8.5 BETA 2
Posted: Jan 08 2013
by Nick
I would suggest daily and above charts built from minute data. Intraday time frames still built from tick.
This would originate a problem when you generate your daily bar from minute data.
Considering minute charts your intraday time frames, every time you request a 405 minute bar which is the total period for the RTH session for ES you would be using tick data. So if you request a 2 year profile based on the RTH period you are downloading tick data since there's no other way to create a daily bar for that period.
I believe IRT's way is the best way, you select how many days of tick data you want, which will be the most recent days and everything prior to that will be minute based.
The question here is more if MC's database structure allows to differentiate this type of data download, X data will be tick and X data will be minute.
That would work well though I think a simple radio button (load from tick or load from minute would suffice). If you are building big/long/old profiles there is no real advantage using ticks for the last few days. your suggestion is certainly more flexible though and flexibility is never a bad thing! The important point is that it needs to be changed (IMHO) as it stands now you can 'stall' things, particularly with lesser data feeds.
Re: MULTICHARTS 8.5 BETA 2
Posted: Jan 08 2013
by arnie
Ahh OK so I am. They perhaps should be labeled naked or virgin rather than extended?
Probably.
The regular VA/POC have extended plot options too, how do they differ? Presumably they do not stop plotting when crossed?
They extend only on their own session.
Re: MULTICHARTS 8.5 BETA 2
Posted: Jan 08 2013
by Nick
Ahh OK so I am. They perhaps should be labeled naked or virgin rather than extended?
Probably.
The regular VA/POC have extended plot options too, how do they differ? Presumably they do not stop plotting when crossed?
They extend only on their own session.
Thanks I think there is probably a requirement to have yesterday's VAH/PoC displayed today (only) you had answered before I edited my post! (I personally don't need this but I have a suspicion that some traders will trade these levels all day.....easy enough to use the drawing tool I guess)
Re: MULTICHARTS 8.5 BETA 2
Posted: Jan 09 2013
by Nick
There appears to be an issue with Developing PoC and Developing Value Area. They are significantly slowing down MC. The other plots I have tested (most not all) that is not the case.
Simply load up 5 days of ES data (I used 1 tick) and change these from invisible and the problem is apparent. Menus tools etc are all significantly slower in the workspace that has a chart with these plots.
Edit: Actually the problem 'went away' on a 5 point range chart but still exists on 1 tick. Strange
Cheers.
Re: MULTICHARTS 8.5 BETA 2
Posted: Jan 09 2013
by Dave Masalov
There appears to be an issue with Developing PoC and Developing Value Area. They are significantly slowing down MC. The other plots I have tested (most not all) that is not the case.
Simply load up 5 days of ES data (I used 1 tick) and change these from invisible and the problem is apparent. Menus tools etc are all significantly slower in the workspace that has a chart with these plots.
Edit: Actually the problem 'went away' on a 5 point range chart but still exists on 1 tick. Strange
Cheers.
Hello Nick,
The issue has been confirmed add added to our fix list. Thank you for reporting.
Re: MULTICHARTS 8.5 BETA 2
Posted: Jan 09 2013
by arnie
When copy/paste windows I get the most weird window sizes possible,
and also different shapes, really small squares, sometimes on the left of the workspace, other times on the right side, maybe in front of a chart, maybe behind the chart and you can't see/know if the chart was indeed pasted...
Re: MULTICHARTS 8.5 BETA 2
Posted: Jan 09 2013
by Dave Masalov
When copy/paste windows I get the most weird window sizes possible,
and also different shapes, really small squares, sometimes on the left of the workspace, other times on the right side, maybe in front of a chart, maybe behind the chart and you can't see/know if the chart was indeed pasted...
We failed to reproduce the issue on our end. Please come to our Live Chat Mon-Fri from 6:30 AM to 1 PM EST so we can help you:
http://messenger.providesupport.com/mes ... pport.html
Re: MULTICHARTS 8.5 BETA 2
Posted: Jan 09 2013
by Dave Masalov
Optimizer Input Problems
...
CRITICAL!
Another Problem related to decimal system where decimal seperator is a comma:
E.g.
In Strategy code:
Input: RISK (0.05), ....
Now when I start optimizing the strategy leaving RISK unchanged, that means start and end value not changed -> Step=1
Only other parameters are changed. Instead of 0.05, MC applies 5 for the value of risk. Please fix it.
Edit: Only in Optimizer!
The issue has been confirmed and will be fixed in the next version.
Re: MULTICHARTS 8.5 BETA 2
Posted: Jan 09 2013
by arnie
When copy/paste windows I get the most weird window sizes possible,
and also different shapes, really small squares, sometimes on the left of the workspace, other times on the right side, maybe in front of a chart, maybe behind the chart and you can't see/know if the chart was indeed pasted...
We failed to reproduce the issue on our end. Please come to our Live Chat Mon-Fri from 6:30 AM to 1 PM EST so we can help you:
http://messenger.providesupport.com/mes ... pport.html
Well, the problem is that this is not easily reproduced.
I've been copy/paste windows this afternoon and not once I could get a weird size/shape. Today I only got that one I posted.
Yesterday I got 3 weird ones.
Re: MULTICHARTS 8.5 BETA 2
Posted: Jan 09 2013
by swz168
More on
#29
Didn't know that there is already a PM entry for
"Realistic multi-currency support to Portfolio Backtesting" and that that feature request has already benn confirmed.
Can you already tell for which version it is targeted?
Re: MULTICHARTS 8.5 BETA 2
Posted: Jan 10 2013
by CrazyNasdaq
Problems with Volume Delta charts based on Point chart resolution with every instrument I select.
No problems if the resolution chart is based on minutes or contracts
IQfeed datafeed - Windows 7 Ultimate 64 bit - MC 8.5 beta 2

Re: MULTICHARTS 8.5 BETA 2
Posted: Jan 10 2013
by Dave Masalov
Problems with Volume Delta charts based on Point chart resolution with every instrument I select.
No problems if the resolution chart is based on minutes or contracts
IQfeed datafeed - Windows 7 Ultimate 64 bit - MC 8.5 beta 2
Hello CrazyNasdaq,
The issue has been confirmed and added to our fix list. Thank you for reporting.
Re: MULTICHARTS 8.5 BETA 2- study crashes
Posted: Jan 10 2013
by sptrader
I occasionally get "catastrophic error" crash with even simple studies. (like CCI)
I notice this only seems to happen on tick or contract bars. It won't happen on minute bars.
Re: MULTICHARTS 8.5 BETA 2
Posted: Jan 10 2013
by Jesh
The volume Delta is no longer available for Point and figure charts, this was available in the first beta, can you please add it back.
Thanks.
Re: MULTICHARTS 8.5 BETA 2
Posted: Jan 11 2013
by arnie
Why can't we see the periodicity of the chart on the window title bar when using volume delta bars?
Re: MULTICHARTS 8.5 BETA 2- study crashes
Posted: Jan 11 2013
by Dave Masalov
I occasionally get "catastrophic error" crash with even simple studies. (like CCI)
I notice this only seems to happen on tick or contract bars. It won't happen on minute bars.
Hello sptrader,
We failed to reproduce the issue on our end. Please send us your workspace, the signal that you use and a .qmd file with data for the symbol (see export instructions here:
https://www.multicharts.com/trading-sof ... rting_Data) so we can reproduce the issue on our end.
Re: MULTICHARTS 8.5 BETA 2
Posted: Jan 11 2013
by Dave Masalov
The volume Delta is no longer available for Point and figure charts, this was available in the first beta, can you please add it back.
Thanks.
Hello Jesh,
Could you be more precise? I am not sure I got you right. Volume Delta and Point&Figure are different chart types. Nothing has changed with respect to that in Beta 2.
Re: MULTICHARTS 8.5 BETA 2
Posted: Jan 11 2013
by Nick
Just a tiny tiny thing but its starting to annoy the bejeezas out of me. The out line rectangle when you mouse over any area of chart that has a profile. Its starting to really irritate me as I move round my charts. Could you change it to so it only appears if you right click on a volume profile element? Or At least have a check box to turn it off.
Another small thing would it be possible to adjust the transparency for the volume profile bell curve itself and the various profile 'lines' separately/ I'd like to turn the bell curve down as it covers a large amount of chart real estate but leave lines to trade against bold. Ideally each plot element could be adjusted individually.
Actually in the longer term it would be a great addition to MC to let you adjust transparency of all drawn objects and indicator plots individually. Visualisation is an important (and often neglected) part of the pie.
Re: MULTICHARTS 8.5 BETA 2
Posted: Jan 11 2013
by arnie
Just a tiny tiny thing but its starting to annoy the bejeezas out of me. The out line rectangle when you mouse over any area of chart that has a profile. Its starting to really irritate me as I move round my charts. Could you change it to so it only appears if you right click on a volume profile element? Or At least have a check box to turn it off.
That rectangle/dash line that surrounds each profile is what makes the profile clickable. If you remove that line and you also choose to make the price bars invisible you have no way to call for the profile settings. The only way is to click on the status line or right mouse click which would generate another 2 clicks till you select the data series you want. Clicking directly on the line is much faster.
There's a known bug with the lines that makes them visible when you move the mouse to another window by the left size but that is being investigated.
The profiles need to be clickable for fast settings access, especially when you use several data series with different profiles but then again, those lines do become annoying from time to time, specially when you are looking at a larger time period.
Maybe we could choose a darker color so they don't be so visible on the chart? Although that could create some difficulty for people to position the mouse on it.
What about make the line smaller in size and darker? Even if we can't position the mouse on it to click it we can click on one of the dots.
Another small thing would it be possible to adjust the transparency for the volume profile bell curve itself and the various profile 'lines' separately/ I'd like to turn the bell curve down as it covers a large amount of chart real estate but leave lines to trade against bold. Ideally each plot element could be adjusted individually.
Can you show an example?
Re: MULTICHARTS 8.5 BETA 2
Posted: Jan 11 2013
by Nick
That rectangle/dash line that surrounds each profile is what makes the profile clickable. If you remove that line and you also choose to make the price bars invisible you have no way to call for the profile settings.
Sorry I absolutely cant agree. Every single object that you place on a chart except profile is selectable by right clicking on any one of its elements. Apart from being annoying as %^@# (pardon my language:)) it is also poor interface design to have everything work one way but profile different. On the rare occasion every single plot of an object is hidden it is still selectable by right clicking it (except profile) if any object has been hidden it is selectable by right click -> format instrument/indicator/drawing
including profile.
I'd settle for it having a visible/invisible checkbox (every other profile element has one) but trading live it is an unacceptable (for me) distraction.
Another small thing would it be possible to adjust the transparency for the volume profile bell curve itself and the various profile 'lines' separately/ I'd like to turn the bell curve down as it covers a large amount of chart real estate but leave lines to trade against bold. Ideally each plot element could be adjusted individually.
Can you show an example?[/quote]
In too much of a rush to make a mock up right now, I will later. What I am saying is it would be cool to set the transparency of each component (in the main component list box) of the profile individually rather than the profile as a whole. You would select it when you slected its colour or other properties. You could work round this use multiple instruments each with a profile but this is not practical if using multiple series already.
It would be good to extend this functionality to every instrument, indicator plot or drawing on a chart one day. Reveal a transparency setting for everything you see on a chart.
Re: MULTICHARTS 8.5 BETA 2
Posted: Jan 11 2013
by arnie
Sorry I absolutely cant agree. Every single object that you place on a chart except profile is selectable by right clicking on any one of its elements. Apart from being annoying as %^@# (pardon my language:)) it is also poor interface design to have everything work one way but profile different. On the rare occasion every single plot of an object is hidden it is still selectable by right clicking it (except profile) if any object has been hidden it is selectable by right click -> format instrument/indicator/drawing including profile.
I'd settle for it having a visible/invisible checkbox (every other profile element has one) but trading live it is an unacceptable (for me) distraction.
Hey, I do agree with you how annoying they can be, although you obviously feel it more than me... but they do have their purpose...
Yes, a visible/invisible option should be available although that option will bring other problems.
The purpose...
Forget the idea of right clicking > Format Instruments > Instruments. That does not work (it's not user friendly). Try to overlay 5 data series where 4 of them have the bars set to invisible. Each data series has its own profile settings.
Now right click > Format Instruments > Instruments. Try to select the data series you want among the 5 available.
By the way... good luck with that!
Examples:
You set your profiles like this:
One of the purpose of the lines is to delimitate the profile reading. This way you have a clear view which profile is the labels referring to.
Naturally that in this case, being a profile per session, we could say that it's not really a big deal to have the lines here since we can clearly see the delimiting lines per session of the chart itself.
But what about when we use the start/end option?
Can anyone tell where is the start of this profile?
Sure we could use the Price Range option but lets say that we don't want too.
Then the lines are a perfect solution for this.
I like the visible/invisible option but that removes also the labels. For that there should be a separate option for the labels.
If there's a visible/invisible option then it can be a color option so we could try to make it a bit darker so it don't stand out so much.
Also bare in mind that beta 2 still have a bug with these lines that make it even more annoying since if we remove the mouse from the profile sometimes the lines continue to be visible.
Re: MULTICHARTS 8.5 BETA 2
Posted: Jan 11 2013
by arnie
In too much of a rush to make a mock up right now, I will later. What I am saying is it would be cool to set the transparency of each component (in the main component list box) of the profile individually rather than the profile as a whole. You would select it when you slected its colour or other properties. You could work round this use multiple instruments each with a profile but this is not practical if using multiple series already.
It would be good to extend this functionality to every instrument, indicator plot or drawing on a chart one day. Reveal a transparency setting for everything you see on a chart.
I've read somewhere that the problem with transparencies is the fact they call for more CPU usage.
Re: MULTICHARTS 8.5 BETA 2
Posted: Jan 11 2013
by sptrader
In too much of a rush to make a mock up right now, I will later. What I am saying is it would be cool to set the transparency of each component (in the main component list box) of the profile individually rather than the profile as a whole. You would select it when you slected its colour or other properties. You could work round this use multiple instruments each with a profile but this is not practical if using multiple series already.
It would be good to extend this functionality to every instrument, indicator plot or drawing on a chart one day. Reveal a transparency setting for everything you see on a chart.
I've read somewhere that the problem with transparencies is the fact they call for more CPU usage.
*************************************************************************
If TOS (and I think NT) can do transparencies then MC can too..
I'd love to use them for coloring the background for different sessions, trend direction etc..
Re: MULTICHARTS 8.5 BETA 2
Posted: Jan 11 2013
by arnie
If TOS (and I think NT) can do transparencies then MC can too..
I'd love to use them for coloring the background for different sessions, trend direction etc..
Yes, it would be nice to be able to color the background for different sessions...
Re: MULTICHARTS 8.5 BETA 2
Posted: Jan 11 2013
by arnie
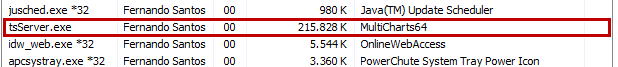
Does anyone noticed that from time to time tsServer does not close right after MC's? It stays there...
It's midnight and I've just spent 8 minutes sit in front of the screen looking at the task manager waiting for it to close so I could go to sleep.
Re: MULTICHARTS 8.5 BETA 2
Posted: Jan 11 2013
by swz168
Please allow us to set a keyboard shortcut for switching on and off strategies.
https://www.multicharts.com/pm/viewissu ... no=MC-1219
Re: MULTICHARTS 8.5 BETA 2
Posted: Jan 14 2013
by Nick
In too much of a rush to make a mock up right now, I will later. What I am saying is it would be cool to set the transparency of each component (in the main component list box) of the profile individually rather than the profile as a whole. You would select it when you slected its colour or other properties. You could work round this use multiple instruments each with a profile but this is not practical if using multiple series already.
It would be good to extend this functionality to every instrument, indicator plot or drawing on a chart one day. Reveal a transparency setting for everything you see on a chart.
I've read somewhere that the problem with transparencies is the fact they call for more CPU usage.
That would not surprise me, I seem to remember a few versions back that rasterizing seemed to become a bigger factor in performance.
Re: MULTICHARTS 8.5 BETA 2
Posted: Jan 14 2013
by Nick
I certainly see where you are coming from but the problem stems from the fact you can only have one profile per data series. This is a sticking plaster solution for a 'broken' (no disrespect to the great work TS are doing) implementation.
Hey, I do agree with you how annoying they can be, although you obviously feel it more than me... but they do have their purpose...
Yes, a visible/invisible option should be available although that option will bring other problems.
It shouldn't bring other problems with it set to visible it could
work exactly as it does now. Identically. Set it invisible and no distracting stuff flickering on and off as you mouse over. I suggest that right click selecting
on the profile rather than
the rectangle should be implemented anyway.
The purpose...
Forget the idea of right clicking > Format Instruments > Instruments. That does not work (it's not user friendly). Try to overlay 5 data series where 4 of them have the bars set to invisible. Each data series has its own profile settings.
Now right click > Format Instruments > Instruments. Try to select the data series you want among the 5 available.
1) You only have to do that if you have turned every element of the profile off. This would normally not be, in any case that is the same as any other object. Normally you should select the profile by right clicking any element,
any. You only need to go though the extra steps above if the profile is completely turned off for some reason.
I am simply suggesting that
a single right click bring up your lines rather than a mouse over. That's really no extra work for the user. In fact it should be quicker and easier, the histogram in the profile is a plenty big enough target to click on! It is also how every other object in MC works. And every other well behaved windows application for that matter.
2) Multiple data series have been used for all sorts of workarounds to problems and people have been managing. In any case you should not have this work in a completely different way to other tools.
Examples:
You set your profiles like this:
One of the purpose of the lines is to delimitate the profile reading. This way you have a clear view which profile is the labels referring to.
Naturally that in this case, being a profile per session, we could say that it's not really a big deal to have the lines here since we can clearly see the delimiting lines per session of the chart itself.
But what about when we use the start/end option?
Can anyone tell where is the start of this profile?
Sure we could use the Price Range option but lets say that we don't want too.
Then the lines are a perfect solution for this.
No I strongly disagree (in a friendly way of course
) In your example above you would simply
single right click on the profile (rather than mouse over) and that brings up your rectangle and numbers. You achieve everything that you need above with a single right click, not arduous at all.
I completely understand how you are using this but that does not mean that it is not wrong on each level!!
Profiles should be selected with a single right click just like every other single object in MC (and just about every windows app written).
Re: MULTICHARTS 8.5 BETA 2
Posted: Jan 14 2013
by Dave Masalov
Does anyone noticed that from time to time tsServer does not close right after MC's? It stays there...
It's midnight and I've just spent 8 minutes sit in front of the screen looking at the task manager waiting for it to close so I could go to sleep.
Hello Arnie,
Please send us your workspace, MultiCharts logs and a dump of tsserver.exe or (see links to the instructions below) come to our Live Chat Mon-Fri from 6:30 AM to 4 PM EST so we can collect all the necessary information ourselves:
http://messenger.providesupport.com/mes ... pport.html
https://www.multicharts.com/trading-sof ... harts_Logs
https://www.multicharts.com/trading-sof ... lect_Dumps
Re: MULTICHARTS 8.5 BETA 2
Posted: Jan 14 2013
by arnie
Problem solved by the guys on LiveChat.
Since I was closing MC first while TWS was still running, TWS was requesting connection to ts.Server and that was the reason ts.Server would hang.
The mean TWS was not letting the poor lad (ts.Server) rest for the day, bad boy, bad boy
Re: MULTICHARTS 8.5 BETA 2
Posted: Jan 15 2013
by arnie
When copy/paste windows I get the most weird window sizes possible,
and also different shapes, really small squares, sometimes on the left of the workspace, other times on the right side, maybe in front of a chart, maybe behind the chart and you can't see/know if the chart was indeed pasted...
We failed to reproduce the issue on our end. Please come to our Live Chat Mon-Fri from 6:30 AM to 1 PM EST so we can help you:
http://messenger.providesupport.com/mes ... pport.html
I believe I was finally able to discover how to reproduce this.
I'll keep testing to confirm this is the correct way to reproduce it and tomorrow I'll go to live chat to show you.
Re: MULTICHARTS 8.5 BETA 2
Posted: Jan 17 2013
by jl12
I have been looking at differences between Deltas in MC and other platforms.
The data feed used is IQ.
I examined an example from the Bund 16/1/13 for trades at 143.27 between 1030 and 1033 , see attached spreadsheet and screen grab.
1679 volume on the bid, 207 on the offer and 62 between.
MC 1679 Bid 269 Ask
MC has added all the volume traded between the Bid and Ask to the Ask.
What is the rule being used for trades falling between bid and ask.
[img][attachment=0]2013-01-16bddelta.png[/img]
Re: MULTICHARTS 8.5 BETA 2
Posted: Jan 17 2013
by Dave Masalov
I have been looking at differences between Deltas in MC and other platforms.
The data feed used is IQ.
I examined an example from the Bund 16/1/13 for trades at 143.27 between 1030 and 1033 , see attached spreadsheet and screen grab.
1679 volume on the bid, 207 on the offer and 62 between.
MC 1679 Bid 269 Ask
MC has added all the volume traded between the Bid and Ask to the Ask.
What is the rule being used for trades falling between bid and ask.
[img][attachment=0]2013-01-16bddelta.png[/img]
Hello jl12,
If Trade price is between Ask and Bid, then Volume direction is determined using Up Tick vs Down tick. However, in your case there has been a rounding issue in the 10th decimal, which resulted in wrong direction. The issue has been confirmed and added to our fix list.
Re: MULTICHARTS 8.5 BETA 2
Posted: Jan 18 2013
by jl12
As a follow up to crazy Nasdaqs example some time ago-
Looking at Deltas on points charts calculation of deltas can differ from the calculation of delta on time bars, however unlike CrazyNasdaqs example deltas are being calculated for one side.
However I have plotted the same data on other occasions and the charts agree.
Is this part of the same issue.
see attached
[[img]attachment=0]DELTA-POINTSvMINS.png[/attachment][/img]
Re: MULTICHARTS 8.5 BETA 2
Posted: Jan 18 2013
by Dave Masalov
As a follow up to crazy Nasdaqs example some time ago-
Looking at Deltas on points charts calculation of deltas can differ from the calculation of delta on time bars, however unlike CrazyNasdaqs example deltas are being calculated for one side.
However I have plotted the same data on other occasions and the charts agree.
Is this part of the same issue.
see attached
[[img]attachment=0]DELTA-POINTSvMINS.png[/attachment][/img]
jl12,
Your point profile is set to Up Tick vs Down Tick. Please change it to Ask Traded vs Bid Traded and the profiles will match.
Re: MULTICHARTS 8.5 BETA 2
Posted: Jan 18 2013
by Dave Masalov
Hello swz168,
Thank your for your suggestion. It has been forwarded to the developers and will be considered for future implementation.
Re: MULTICHARTS 8.5 BETA 2
Posted: Jan 20 2013
by ahlam
Hi all,
had started using the MC 8.0.5620 for a couple of week and trade with IB and is quite satisfied except that I have 2 linked accounts in IB so I can only use the AA mode instead of SA mode.
came across a thread about the linked account
http://www.multicharts.com/discussion/v ... unt#p57609
so downloaded the 8.5.6528 Beta 2 but the software just keep on reporting error (and of course keep sending out error reports), so finally re-install the 8.0.5620 again to trade.
Hope the final version of 8.5 will be more stable to solve my linked account problem.
Re: MULTICHARTS 8.5 BETA 2
Posted: Jan 20 2013
by MC_Prog
Hi.
It appears the keyword barnumber is not working correctly (at least not in all cases).
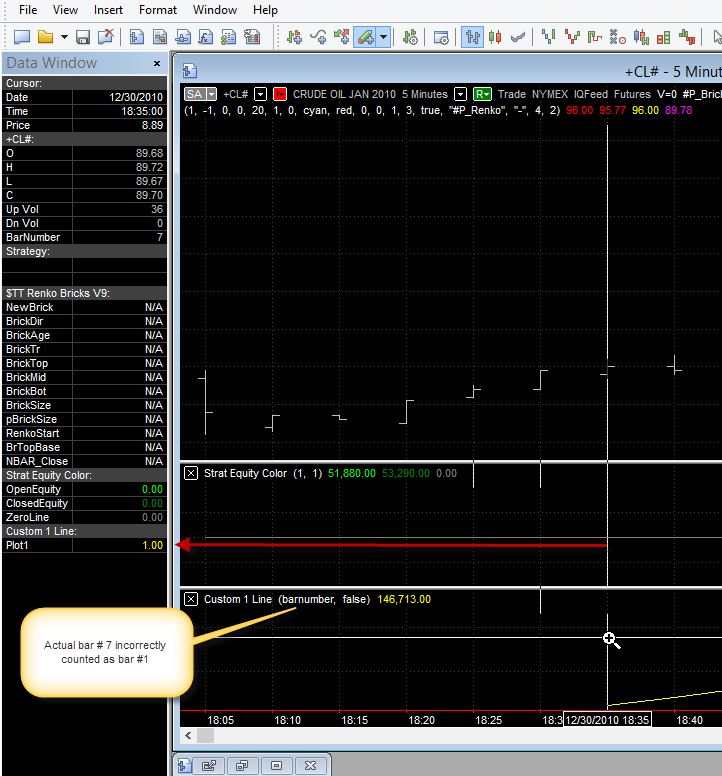
This is with Max number of bars study will reference set to Auto-detect.
Re: MULTICHARTS 8.5 BETA 2
Posted: Jan 20 2013
by ABC
Hi.
It appears the keyword barnumber is not working correctly (at least not in all cases).
MC_Prog,
this usually has something to do with the Max Bars back setting of your indicator.
To my understanding it starts with 1 at the time the Max Bars back setting is reached, try setting it to 1instead of using the auto feature.
If this is good behavior or not might be arguable, as it can be confusing comparing barnumbers between two studies on the same chart.
Regards,
ABC
Re: MULTICHARTS 8.5 BETA 2
Posted: Jan 20 2013
by arnie
For some reason my computer (Windows) went down and since I really didn't have the patience to find out what was wrong with it I decide to just to use my disk image and have a "clean" system. Amazingly a year already had past since the last time I cleaned the system with a fresh new installment.
Since I have all my files always backed up, twice, using an online service and a backup disk in my computer I really have no problems with my system going down.
But all of this to say the following, didn't MC save its settings, namely the dispositions of the tools? I would swear that with other MC versions every time I installed it, all my tools were where I had left them but today they are all on their default position.
It seems that I miss a file there where MC settings are saved.
I can't find any reference to it in the
Wiki.
By the way, it would be nice that the keyboard shortcuts could be also saved because it's a bit of a pain to set them all again.
Re: MULTICHARTS 8.5 BETA 2
Posted: Jan 22 2013
by Dave Masalov
It's of the utmost importance to find a solution for this.
QM needs to have an option so continuous contracts can be back-adjusted, otherwise we will never have more than 120 days of data.
Arnie, ABC,
What you describe should be fairly easily accomplished using Custom Futures feature in MultiCharts:
https://www.multicharts.com/trading-sof ... om_Futures
Unfortunately Custom Futures is something that we cannot use since it does not support volume profile.
This should be something simple as picking the symbol we want, open its settings and select an option where we could have the time to select the rollover and the back-adjustment settings. From that point on, that symbol, that data, would be back-adjusted every single time a new contract would be added.
Theoretical, when moving historical prices up or down according to the adjustment ratio, volume, being aggregated to price, should follow it.
So if prices after the adjustment raises 6 pts, from 1400 to 1406 and if at 1400 we had 56200 contracts traded, after prices being adjusted, now at 1406, we should have the same 56200 contracts. This would allow us to have access to volume profile and delta. Actually, it's really not an option not having access to volume profile and delta.
Volume Profile for Custom Futures will be implemented in one of the next versions. As a workaround, you can plot a 1 tick Custom Futures chart, export its data (File -> Export Data) to a file and then import it to the continuous symbol in the QuoteManager. With such setup you must avoid reloading data on the chart (Ctrl+R) since it will overwrite the imported data.
Re: MULTICHARTS 8.5 BETA 2
Posted: Jan 22 2013
by Dave Masalov
Hi all,
had started using the MC 8.0.5620 for a couple of week and trade with IB and is quite satisfied except that I have 2 linked accounts in IB so I can only use the AA mode instead of SA mode.
came across a thread about the linked account
http://www.multicharts.com/discussion/v ... unt#p57609
so downloaded the 8.5.6528 Beta 2 but the software just keep on reporting error (and of course keep sending out error reports), so finally re-install the 8.0.5620 again to trade.
Hope the final version of 8.5 will be more stable to solve my linked account problem.
Hello ahlam,
Could you describe the error message you got? What was the sequence of actions leading to the issue?
Re: MULTICHARTS 8.5 BETA 2
Posted: Jan 22 2013
by Dave Masalov
Hi.
I'm pretty sure there is something wrong with the Optimizer in relation to a) the check box, b) the current value, c) the start/end/step values, d) what the optimizer actually iterates over or tests.
I have a strategy here (sorry I cannot supply it) where I'm iterating over stops and targets and getting no difference in outcome.
Another observation is that when using the optimizer to sweep some parameters over a set which includes a particular well-performing iteration, that iteration is not found in the results. Yet, if I type those params in by hand in the signal format window I again get the well-performing result.
I realize it would be most helpful if I could provide you an exact set of replicable steps, and I'm sorry I can't at this moment. However, after some hours of working on this, I'm pretty sure something is not right and engineering will need to revisit this.
Today I very carefully observed and then went thru a sequence of steps to produce the attached Word document.
This document proves (I believe) the existence of a bug. (It's also as much as I can do about this personally right now.)
I very much hope this is fixed in Beta3, as the new optimization configuration and save/reload capabilities will be a superb addition to MC once they are working correctly and reliably.
P.S. I have entered this in PM as MC-1208 - Optimizer changes values when not instructed to do so
Hello MC_Prog,
The issue has been fixed. The fix will be available in the next version. Thank you for reporting.
Re: MULTICHARTS 8.5 BETA 2
Posted: Jan 22 2013
by ahlam
Thanks Dave,
actually I just run the Beta 2 and then everytime I tried to open a new chart and then a pop-up error message appeared.
I had installed back the 8.0 and is currently using it, may be will try the Beta 2 on Saturday or Sunday and then report more clearly to you, thanks.
Re: MULTICHARTS 8.5 BETA 2
Posted: Jan 22 2013
by Dave Masalov
Thanks Dave,
actually I just run the Beta 2 and then everytime I tried to open a new chart and then a pop-up error message appeared.
I had installed back the 8.0 and is currently using it, may be will try the Beta 2 on Saturday or Sunday and then report more clearly to you, thanks.
ahlam,
If the problem occurs again, please send us a screenshot of the error message as well as MC Logs collected after the issue has occured, but before restarting MultiCharts (see instructions here:
https://www.multicharts.com/trading-sof ... harts_Logs).
Re: MULTICHARTS 8.5 BETA 2
Posted: Jan 22 2013
by Dave Masalov
For some reason my computer (Windows) went down and since I really didn't have the patience to find out what was wrong with it I decide to just to use my disk image and have a "clean" system. Amazingly a year already had past since the last time I cleaned the system with a fresh new installment.
Since I have all my files always backed up, twice, using an online service and a backup disk in my computer I really have no problems with my system going down.
But all of this to say the following, didn't MC save its settings, namely the dispositions of the tools? I would swear that with other MC versions every time I installed it, all my tools were where I had left them but today they are all on their default position.
It seems that I miss a file there where MC settings are saved.
I can't find any reference to it in the
Wiki.
By the way, it would be nice that the keyboard shortcuts could be also saved because it's a bit of a pain to set them all again.
Hello arnie,
Toolbar configuration is stored in Windows registry. You can backup the following keys:
HKEY_LOCAL_MACHINE\SOFTWARE\TS Support
HKEY_CURRENT_USER\Software\TS Support
As for the keyboard shortcuts, they are saved here: %USERPROFILE%\AppData\Roaming\TS Support\MultiCharts\HotKeys
Re: MULTICHARTS 8.5 BETA 2
Posted: Jan 22 2013
by Dave Masalov
It would be useful to have the option to build profiles from minute data rather than tick data, that is plenty accurate enough for these larger profiles.
Nick, Arnie,
This option will be added in the future.
Re: MULTICHARTS 8.5 BETA 2
Posted: Jan 24 2013
by Dave Masalov
Dear Users,
Thank you for your feedback. All reported issues have been fixed and the fixes will be available in Multicharts 8.5 Release.
Re: MULTICHARTS 8.5 BETA 2
Posted: Feb 04 2013
by admin