plot open and close on two or more data series
Posted: Apr 12 2013
Hi guys.
I'm stuck again so I'd like some help.
I wrote a pretty basic (I thought) study to plot the open and close over profiles.
When plotted on a single data series the study acts as it should.
But when applied on 2 data series things start to get weird.
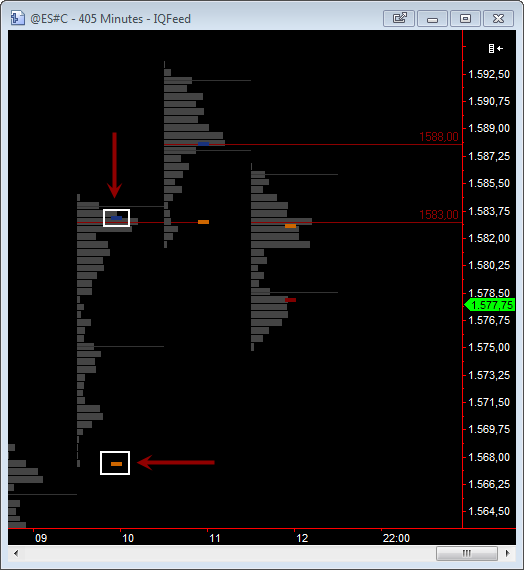
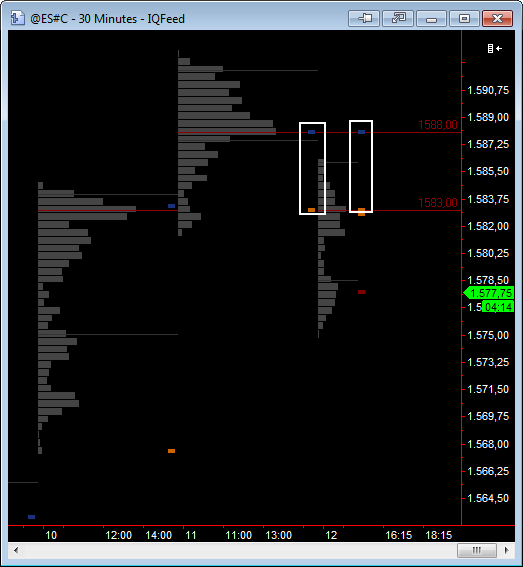
In here I have a 30 minute series and a 405 minute series.
The study is applied on the 405 minute.
See how yesterday's open and close are also plotted on today's session.
The idea of having the 30 minute series is to see the bars whenever I want. When the keyboard shortcut for invisible bars is available I will easily toggle between visible and invisible bars.
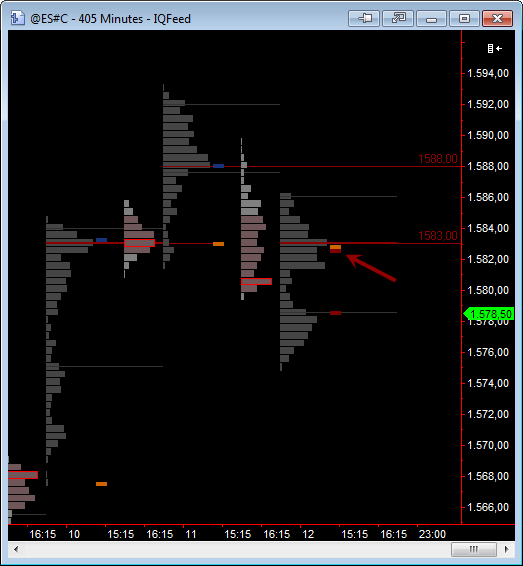
In here I have the exact same problem.
In here I have a 405 minute and a 930 minute series. One represents the RTH and the other the ETH session.
I use two series so I can color the overnight differently for a better view.
In here I plot the study twice, one applied on the 405 and the other on the 930 series.
The 405 shows the open and close whereas the 930 only shows the close for the last session since I really don't care where previous ETH sessions made their open and close.
Can anyone enlight me in what is going on here?
Here is the code:
I'm stuck again so I'd like some help.
I wrote a pretty basic (I thought) study to plot the open and close over profiles.
When plotted on a single data series the study acts as it should.
But when applied on 2 data series things start to get weird.
In here I have a 30 minute series and a 405 minute series.
The study is applied on the 405 minute.
See how yesterday's open and close are also plotted on today's session.
The idea of having the 30 minute series is to see the bars whenever I want. When the keyboard shortcut for invisible bars is available I will easily toggle between visible and invisible bars.
In here I have the exact same problem.
In here I have a 405 minute and a 930 minute series. One represents the RTH and the other the ETH session.
I use two series so I can color the overnight differently for a better view.
In here I plot the study twice, one applied on the 405 and the other on the 930 series.
The 405 shows the open and close whereas the 930 only shows the close for the last session since I really don't care where previous ETH sessions made their open and close.
Can anyone enlight me in what is going on here?
Here is the code:
Code: Select all
Inputs:

	ShowOpen			(true),

	ShowClose			(true),

	ShowCloseLastBarOnly		(false),

	BarStatusData			(1),

	openColor			(rgb(205,102,0)),

	upCloseColor			(rgb(25,50,124)),

	dnCloseColor			(rgb(128,0,0));


if ShowOpen then

	plot1(open, "open", openColor);


if ShowClose then begin

	if close > Open then

		plot2(close, "upClose", upcloseColor)

	else

		plot2(close, "dnClose", dncloseColor);

end;


if ShowCloseLastBarOnly = true then begin

	if close > open then

		plot3(close, "upLastClose", upcloseColor)

	else

		plot3(close, "dnLastClose", dncloseColor);


end;


if barstatus(BarStatusData) = 2 then

	NoPlot(3);