Henry,
This behavior within the scaling of multiple symbols has been here since I started in MC 6. I'm currently running 8.7 7631 release and 8.8 RC 8231. I've seen others post about it as well.
To duplicate this behavior, find two instruments that are similar in price, but not identical. Then scroll through the chart and pay attention to data2 floating on no axis.
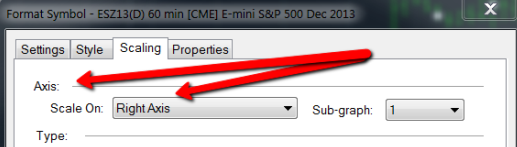
The issue is that data2/data3/data4 .. do not have a price axis. They just plot on a scale set by the screen size (??). If we were able to select the price axis for all symbols on the chart, this would be fixed

Much like a competitor did:
As you requested, I'll place the workspace here. Please use the symbols I've given and scroll back to 8/26/2013 for the most dramatic example.