Page 1 of 1
Accessing last "N" T&S records - for any chart type
Posted: Jan 06 2014
by vking
Hello - Can anyone post a sample code to access the last "N" T&S records for an instrument? Preferably would like to use it on a scanner/chart combination. Main intention is to get access this T&S array - irrespective of the chart type used ( independent of the bar they belong to. Appreciate any input on this.
information needed :
- Time, Price, Volume & Trade type ( ask/bid/below bid/above offer/other)
Thanks in advance.
Re: Accessing last "N" T&S records - for any chart type
Posted: Jan 07 2014
by Henry MultiСharts
Hello vking,
If you want to operate with the Time and Sales data then you need to utilize the Volume Profile data collection. Here is how to do that:
4.7.6_Volume_Profile
Re: Accessing last "N" T&S records - for any chart type
Posted: Jan 29 2014
by franky
Hi Henry,
I understand that the volume profile data collection need to be used for getting an accurate time & sales instead of the Bars.UpTicksValue and Bars.DownTickValue but I have problem getting the info timewise. Would it be possible to get a sample code to see in realtime the time & sales ? I think it would help a lot of people.
Thanks a lot.
Re: Accessing last "N" T&S records - for any chart type
Posted: Jan 31 2014
by Henry MultiСharts
Hi Henry,
I understand that the volume profile data collection need to be used for getting an accurate time & sales instead of the Bars.UpTicksValue and Bars.DownTickValue but I have problem getting the info timewise. Would it be possible to get a sample code to see in realtime the time & sales ? I think it would help a lot of people.
Thanks a lot.
Attached is a sample indicator that plots the last time & sales value in realtime. You need to have the Volume Profile enabled for the data series the indicator is based on.
Re: Accessing last "N" T&S records - for any chart type
Posted: Jan 31 2014
by franky
Volume for any tick is easy to know ... but how to know if it was done on the bid or the ask.... ? Comparing the tick volume with the bid and ask time series gives some problems. It would be nice to get a volume based on the bid/ask like Bars.askticksvalue & Bars.bidticksvalue or bars.volumeside ....
Re: Accessing last "N" T&S records - for any chart type
Posted: Feb 04 2014
by Henry MultiСharts
Volume for any tick is easy to know ... but how to know if it was done on the bid or the ask.... ? Comparing the tick volume with the bid and ask time series gives some problems. It would be nice to get a volume based on the bid/ask like Bars.askticksvalue & Bars.bidticksvalue or bars.volumeside ....
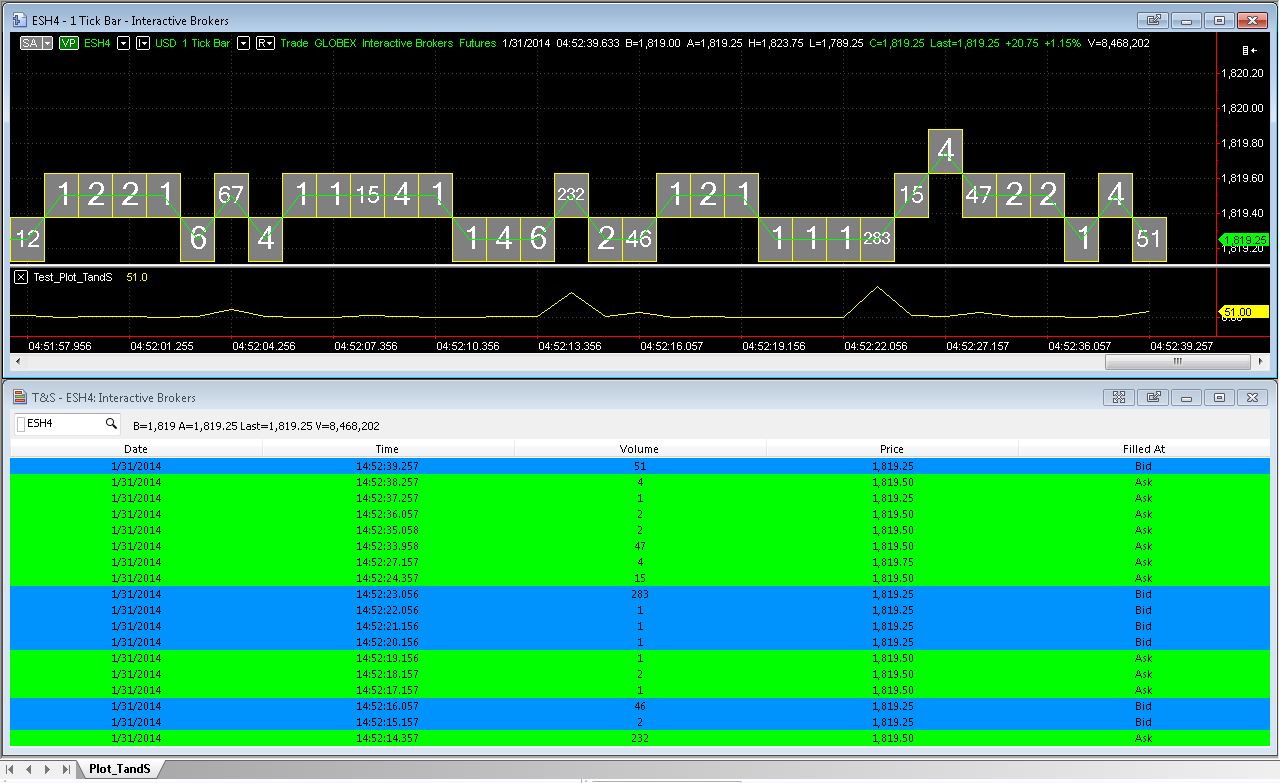
franky, please find attached the code that plots "Price, Volume, Filled at Ask/Bid" values.

Re: Accessing last "N" T&S records - for any chart type
Posted: May 11 2016
by ssander
Hi Henry,
that is a fine piece of code and nearly what i am currently looking for, if it would also print the current bid/ask depth (would need both regardless of trade direction) on every trade made. I spent two days to implement this myself but failed, maybe you could provide an update?
Something like that would be awesome:
Price(1,769.75) / Volume(9) / FilledAt(Ask) /CurrentBidDepth(435 = lmt-orders on bid) / CurrentAskDepth(50 = lmt-orders on ask)
Thanks a lot for your time in advance.
Stefan