Page 1 of 1

any chance of having this coded for .NET?

Posted: Aug 19 2015
by arnie
Hi.

Here is another basic study that everyone should have in their chart platform. A study that plots the OHLC, namely yesterday's RTH high, low, close, yesterday's full day high and low, today's overnight high and low and also today's RTH high, low and open.
The result would be something similar to this

Image

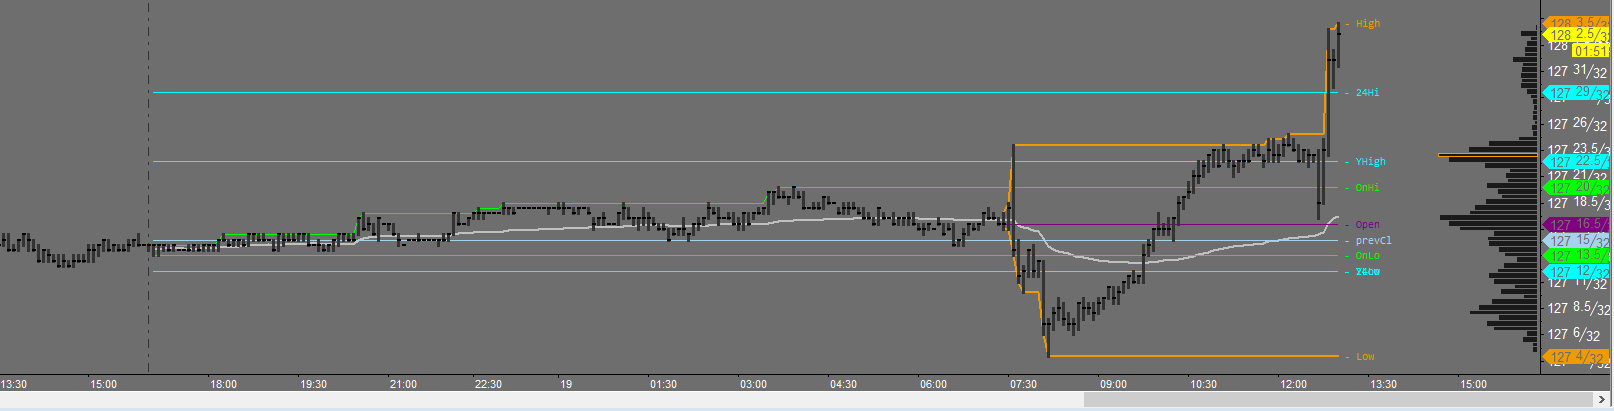
For better management of all plotted data, we should have inputs for each group since user might not want to see everything plotted at the same time. Also, a time input would facilitate the settings for ETH and RTH session so it could be applied in every market.

Re: any chance of having this coded for .NET?

Posted: Aug 19 2015
by JoshM
I'll try to code this for you if it's not urgent (I'm working on another script that I want to finish first, so I won't start working on it right away). I'll let you know the progress on this 'session OHLC' indicator.

Re: any chance of having this coded for .NET?

Posted: Aug 21 2015
by arnie
I'll try to code this for you if it's not urgent (I'm working on another script that I want to finish first, so I won't start working on it right away). I'll let you know the progress on this 'session OHLC' indicator.
For sure Josh, no urgency. I'm happy that someone is offering their knowledge to make the .NET study experience more rich.

And not wanting to push my luck here, remember this thread viewtopic.php?f=20&t=46112 ?
Will it be possible to code it now?
Personally, I really don't care anymore about the channels, way too much information. I just would like the VWAP. You can see it plotted in the chart above, the gray line.

Regards

Re: any chance of having this coded for .NET?

Posted: Aug 24 2015
by JoshM
Here is another basic study that everyone should have in their chart platform. A study that plots the OHLC, namely yesterday's RTH high, low, close, yesterday's full day high and low, today's overnight high and low and also today's RTH high, low and open.
I'm pretty far in terms of progress, but I'm not clear about what "24Hi" and "24Lo" mean. These are horizontal charts on your chart, but I interpreted it as the 'highest high and lowest low of the last 24 hours' based on their name (24Hi and 24Lo).

That would give a chart where the "24Hi" and "24Lo" lines are not horizontal but move along the price action of the last 24 hours, like this:

Image

If you can say what 24Hi and 24Lo mean, that would be great.
And not wanting to push my luck here, remember this thread viewtopic.php?f=20&t=46112 ?
Will it be possible to code it now?
Personally, I really don't care anymore about the channels, way too much information. I just would like the VWAP. You can see it plotted in the chart above, the gray line.
You're surely not pushing your luck. :) It's no problem; I'll look into that indicator after the session OHLC (taking it one at a time).

Re: any chance of having this coded for .NET?

Posted: Aug 24 2015
by arnie
I'm pretty far in terms of progress, but I'm not clear about what "24Hi" and "24Lo" mean. These are horizontal charts on your chart, but I interpreted it as the 'highest high and lowest low of the last 24 hours' based on their name (24Hi and 24Lo).

That would give a chart where the "24Hi" and "24Lo" lines are not horizontal but move along the price action of the last 24 hours, like this:

Image

If you can say what 24Hi and 24Lo mean, that would be great..
24hHi and 24hLo actually are indicating yesterday's full day (ETH + RTH) high and low.
Some traders prefer to just look at regular trading hours, others the entire full day session. Personally I like to look at both separately.
This way the study extends into today's session yesterday's RTH session high and low and yesterday's full session high and low. That's why they plot horizontal lines.

Today's full session high and low can be viewed by looking at the overnight high and low and the RTH high and low, so there's no need to plot it.

I see that you are also making the lines start plotting only when today's trading day starts, not plotting them for the prior days (I love that), although you should give the option to show the lines on previous days since there are traders that need to see them.

The study will recognize futures full trading day right? The full trading day for ES for example, starts today at 17:00 pm and ends tomorrow at 16.15 pm.

Did MC coded the CurrentSession function for .NET?
You're surely not pushing your luck. :) It's no problem; I'll look into that indicator after the session OHLC (taking it one at a time).
For sure Josh. One at a time.
A big thank you I give you for all this work.

Re: any chance of having this coded for .NET?

Posted: Aug 25 2015
by JoshM
I see that you are also making the lines start plotting only when today's trading day starts, not plotting them for the prior days (I love that), although you should give the option to show the lines on previous days since there are traders that need to see them.
Yes, that's possible but traders will need to change the lines to 'points' or 'cross' because otherwise those 'ugly connecting lines' appear.
The study will recognize futures full trading day right? The full trading day for ES for example, starts today at 17:00 pm and ends tomorrow at 16.15 pm.
Yes, it can deal with those overnight sessions.
Did MC coded the CurrentSession function for .NET?
I don't know; it's not in my MC NET install. I also don't know of that function.

=======
session-ohlc.zip
(7.59 KiB) Downloaded 435 times
The indicator (see above) now looks like:

Image

It has these inputs (hopefully, all of them are self-explanatory):

Image

If someone finds an error/bug or has a further suggestion, please let me know. I consider this version a first release, so it's likely not perfect.

Re: any chance of having this coded for .NET?

Posted: Aug 25 2015
by arnie
Nice!

Many thanks JoshM.

It seems there's a bug there.
Image

Using the 16:15 has the time end the lines start plotting a couple of bars back, from yesterday.

ES pit opens at 8:30CT and closes at 15:15CT. From 15:30 till 16:15 it's ETH session.
Previous close should use the 15:15 bar and not the 16:15 which is the end of the trading day. Well, at least that is the close I'm interested to see. Since this is available to all, maybe other prefer to see the full trading day close and not the RTH. Maybe it's preferable to have both closes available.

If we use the 15:15 time for the end, the close will be plotted correctly but the study will start plotting the next bar has the new trading day, when in fact it only starts 45 minutes later at 17:00.

Image

Maybe it's easier to use 2 set of time inputs, one for RTH ( 830 to 1515) and another for ETH (1700 to 830)? Those last 45 min will be in sort of a limbo but traders can easily see how it was traded looking at the chart and where the RTH stop trading.

Also, I think it's easier to group the highs and lows inputs. Plot Overnight HiLo, Plot Yesterday HiLo and so forth instead of having an input for each high and low.

Re: any chance of having this coded for .NET?

Posted: Aug 25 2015
by JoshM
What resolution are you using with those screenshots? Then I can replicate it here.

By the way, if you have a non-time based resolution it's unfortunately not possible to retrieve the exact closing time of 16:15 since an indicator can only access the bar's closing time (not the ticks inside the bar). If you have a time-based chart, then it can, but just saying for clarification. :]

Re: any chance of having this coded for .NET?

Posted: Aug 25 2015
by arnie
What resolution are you using with those screenshots? Then I can replicate it here.

By the way, if you have a non-time based resolution it's unfortunately not possible to retrieve the exact closing time of 16:15 since an indicator can only access the bar's closing time (not the ticks inside the bar). If you have a time-based chart, then it can, but just saying for clarification. :]
Yes I know, all studies that are time based cannot work properly in non time based charts.
The first chart is a 5min one and the second is a 15min.
The time template I'm using is this

Image

Re: any chance of having this coded for .NET?

Posted: Aug 26 2015
by JoshM
The first chart is a 5min one and the second is a 15min.
The time template I'm using is this

Image
With that template, on a 5 minute chart set to exchange time, and the indicator set to 8:30 till 16:15 I don't have that error:

Image

What am I missing/overlooking?

(On a 15minute chart I also cannot replicate it).

(Edit: Didn't find anything in the changelog that can affect this, since I'm still on MultiCharts .NET64 Version 9.0 Release (Build 10362)).

Re: any chance of having this coded for .NET?

Posted: Aug 26 2015
by arnie
Here are more charts hoping to help debug this.

Using exchange time, not plotting previous days, you can see that the study starts plotting at 16:00 the prior day.

Image

I then decided to switch to local time.
Again, it starts plotting at 16:00 the prior prior day

Image

Then I tested with plotting all the prior days and this actually looks correct. It starts plotting/the trading day at the correct time, at 17:00.

Image

It seems that when it plots all days the study resets the trading day at the correct time but when it plots only the last day something gets off.

Attached ES data for this month. Test with my data to see what happens.

Re: any chance of having this coded for .NET?

Posted: Aug 27 2015
by JoshM
Thanks for the additional information and ES data; I think I fixed this error now.

It now looks like this:
Image
sessions-ohlc-v2.pln
(4.1 KiB) Downloaded 630 times
I hope it works for you now like you intended. I also added an additional input for specifying the close time other than RTH close.

And my apologies for that it didn't worked earlier, although I'm pretty sure it annoyed me much much more than it annoyed you. :)

Re: any chance of having this coded for .NET?

Posted: Aug 27 2015
by arnie
Beautiful work JoshM.

I'm sorry to say this but.... it seems there's a small bug there yet :(
I made a video

http://www.screencast.com/t/ghNlGWvialA

You plot the study and all's fine, you switch it off and when you switch it back on the 24h high and low labels are not there anymore.

And by the way, while reviewing the video I noticed that by that time ZN was making new pit lows but the low label could not be seen. Only when I switched the study off/on the labels became visible again. Maybe the label problem is not only with the 24h high and low...

Sorry for making this way too more complicate than originally sounded :(

Re: any chance of having this coded for .NET?

Posted: Aug 27 2015
by JoshM
Sorry for making this way too more complicate than originally sounded :(
That's not a problem, I made the coding error not you. ;)

Anyway, I've fixed/changed:
- Inputs to combine overnight and 24hour data (as mentioned in an earlier post),
- Fixed the label that was missing (thanks for the video, that was a big help),
- Fixed the updating of the text labels (like OnLow, OnHigh when new low/highs are formed).

I'll post the indicator tomorrow or later, primarily because the 'missing label' problem was just an oversight error. I guess I wanted to have the indicator done too quickly for you, which ironically might have costs both of us more time. :)

Re: any chance of having this coded for .NET?

Posted: Aug 28 2015
by JoshM
New version:
sessions-ohlc-v2.pln
(4.42 KiB) Downloaded 691 times
I couldn't find an error with it on my side, hopefully it's the same for you.

Have a nice weekend, :)

Re: any chance of having this coded for .NET?

Posted: Aug 28 2015
by arnie
New version:
sessions-ohlc-v2.pln
I couldn't find an error with it on my side, hopefully it's the same for you.

Have a nice weekend, :)
I think you've sent the wrong file.
Shouldn't it be version 3?
I'm saying this because it has the same label bug.

Re: any chance of having this coded for .NET?

Posted: Aug 29 2015
by JoshM
I think you've sent the wrong file.
Shouldn't it be version 3?
I'm saying this because it has the same label bug.
Yes, it's the correct .pln file.

Sorry, but I'm not seeing the label issue on MultiCharts .NET64 Version 9.0 Release (Build 10362). I did see something else that I couldn't explain with the code (and that seems to be a MultiCharts issue), so I contacted MultiCharts Support on that.

It might take a while before I can continue working on it though, since I also have 2 other open issues with Support from 4 weeks ago that I haven't received an update yet on.

Re: any chance of having this coded for .NET?

Posted: Aug 29 2015
by arnie
Yes, it's the correct .pln file.

Sorry, but I'm not seeing the label issue on MultiCharts .NET64 Version 9.0 Release (Build 10362). I did see something else that I couldn't explain with the code (and that seems to be a MultiCharts issue), so I contacted MultiCharts Support on that.

It might take a while before I can continue working on it though, since I also have 2 other open issues with Support from 4 weeks ago that I haven't received an update yet on.
Oops. Ma bad.
I compiled the wrong file :(

When you get the time and the reply from support, there are a couple of things that should be addressed.
Why not also aggregate yesterdays high and low and todays high and low into single inputs like you did with overnight and 24h?

Image

Now regarding the RTH high and low, there's a problem with the reading and plotting.
The chart is the 10 year note.
Overnight (ETH - electronic trading hours) starts at 17:00 and ends at 7:20. Pit session (RTH - regular trading hours) starts at 7:20 and ends at 14:00. Between 14:00 and 16:00 it's another ETH session.

The RTH high and low at the moment is plotting between 7:20 and 16:00. The 7:20 marks the start of the pit session which is correct but the 16:00 is marking the end of the trading day and not the end of the pit session which is given by the third time input you added to mark the RTH (pit) close.

So you can see in the chart that after the pit close at 14:00, the 10 year made new high for the day, above the pit high. The pit high line after 14:00 should not continue to update, it should extend that last high till the end of the day at 16:00. You can also see that at the next day what was extended was the 24h high which was also the pit high according to the study but in fact, although the 24h high is OK at 15.5, the pit high was at 14, not 15.5.

Image

I hope I'm making myself understood. When we get too technical things can become quite confuse.
It's just a problem of time reading.

Here's another thing I've just noticed, it seems the study starts the reading 1 bar before the pit open.
Using the 10 year as example, if the pit opens at 7:20, the time stamp of the first bar on a 5 minute chart is 7:25 but the study is starting the reading at 7:20 bar which can give a wrong open price and also a wrong high and low.
Since the bar time stamp in MC is the bar close the study needs to use the first bar after the RTH_Begin time to start the RTH(pit) high, low and open calculations.

Re: any chance of having this coded for .NET?

Posted: Aug 30 2015
by JoshM
Now regarding the RTH high and low, there's a problem with the reading and plotting.
The chart is the 10 year note.
Overnight (ETH - electronic trading hours) starts at 17:00 and ends at 7:20. Pit session (RTH - regular trading hours) starts at 7:20 and ends at 14:00. Between 14:00 and 16:00 it's another ETH session.

The RTH high and low at the moment is plotting between 7:20 and 16:00. The 7:20 marks the start of the pit session which is correct but the 16:00 is marking the end of the trading day and not the end of the pit session which is given by the third time input you added to mark the RTH (pit) close.
Okay, I'll see if I can recode the indicator to work with multiple trading sessions. I'll probably add an input for the ETH session, or do you also want to plot the 'non regular RTH' hours on the chart (so plotting the OHLC of 7:20-14:00 and plotting the OHLC values from 14:00-16:00)?

*removed rant*

Re: any chance of having this coded for .NET?

Posted: Sep 01 2015
by MidKnight
This should be start of the standard indicator suite instead of the huge majority of other junk indicators packaged.

With kind regards,
MK

Re: any chance of having this coded for .NET?

Posted: Sep 01 2015
by MidKnight
I have a version of this, but it may not work if your after hours session spans past midnight - is that of any use to you?

Re: any chance of having this coded for .NET?

Posted: Sep 01 2015
by arnie
I have a version of this, but it may not work if your after hours session spans past midnight - is that of any use to you?
I really need/want to see the entire day so the reset at midnight does not suits my needs.
Thanks for your help though.

And you're right, basic studies such as this one should be part of the default package on MC. I'd love to know the number of times a MC user actually use most of the studies that MC has by default.

SC for example accept studies coded by their users and after they test it the study becomes part of the default package. This is a great feature for users to have and of course a great way for them to maintain the platform always updated with the most "trendy" studies at the moment, attracting this way new users.
See also IRT. They invest a lot in study development.

A platform not only needs to have great built in tools but also great built in studies.
And while MC in the built in tools department is spotless, in the studies department things can become really poor. For those with programming knowledge there's no problems, business as usual, but for those without programming knowledge and rely on the available studies, I'm sure MC is not on the top of their wishing list.

Re: any chance of having this coded for .NET?  [SOLVED]

Posted: Sep 12 2015
by JoshM
By the way, the indicator is done and seems to be working correctly as far as we can tell. I've placed it here: Sessions OHLC.

If you find an error or if there's anything else, let me know. :]

Re: any chance of having this coded for .NET?

Posted: Sep 13 2015
by MidKnight
This looks far superior to what I coded and use. Thanks so much for the effort JoshM. A tool like this should have been included in the default indicator suite for MC.net.

With kind regards,
MK

Re: any chance of having this coded for .NET?

Posted: Nov 02 2020
by samuelhogg
Hi,

Does anyone have the final version of this as the tradingscripts.net website doesn't appear to be up anymore?

Kind regards
By the way, the indicator is done and seems to be working correctly as far as we can tell. I've placed it here: Sessions OHLC.

If you find an error or if there's anything else, let me know. :]