Page 1 of 1

vertical line on chart

Posted: Apr 03 2021
by chipeur_le_renard
hi

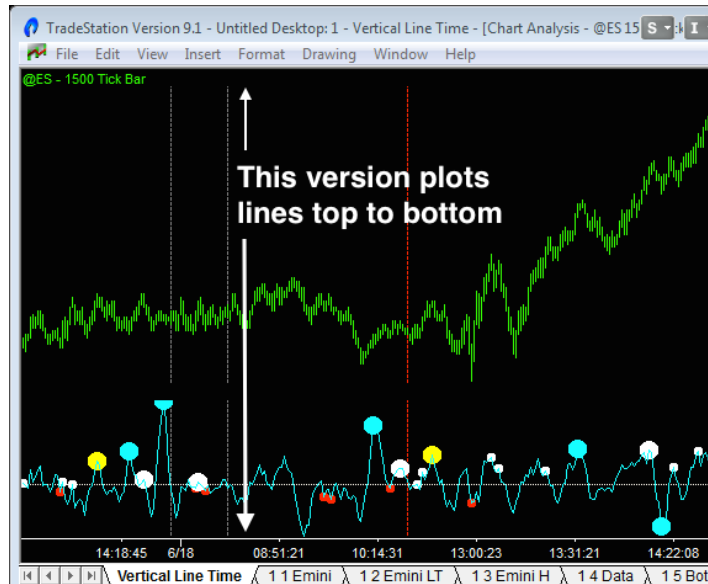
can one of you explain how to draw a vertical line on a chart

i post an example

Code: Select all

Inputs: Line1(True), LineTime1(0830), String LineColor1("Gray"), Line2(True), LineTime2(1100), String LineColor2("Red"), Line3(True), LineTime3(1515), String LineColor3("Gray"); Using elsystem.drawingobjects; Using elsystem.drawing; Variables: VerticalLine VL(null); Method void DrawVerticalLine() begin VL = VerticalLine.Create(DTPoint.Create(BarDateTime,0)); VL.Persist = False; DrawingObjects.Add(VL); End; If Line1 and T >= LineTime1 and T[1] < LineTime1 then begin DrawVerticalLine(); VL.Color = Color.FromName(LineColor1); VL.Style = StyleType.Dashed; VL.Weight = 0; End; If Line2 and T >= LineTime2 and T[1] < LineTime2 then begin DrawVerticalLine(); VL.Color = Color.FromName(LineColor2); VL.Style = StyleType.Dashed; VL.Weight = 0; End; If Line3 and T >= LineTime3 and T[1] < LineTime3 then begin DrawVerticalLine(); VL.Color = Color.FromName(LineColor3); VL.Style = StyleType.Dashed; VL.Weight = 0; End;

with this example on TS you can draw this vertical line Using elsystem.drawingobject and elsystem.drawing;


Image


thx for help

regards

Re: vertical line on chart

Posted: Apr 03 2021
by TJ
Please see post #1 & #2
viewtopic.php?t=11713

Re: vertical line on chart

Posted: Apr 04 2021
by chipeur_le_renard
sorry now it s perfect no ???

Re: vertical line on chart

Posted: Apr 04 2021
by TJ
The code is not Easylanguage. It is in TS OOP extension.

It is impossible to make a translation or conversion to MultiCharts.
You have to rewrite the whole thing.

Re: vertical line on chart

Posted: Apr 04 2021
by TJ
Try this:

Note: set plot style as Histogram

Code: Select all

Inputs: Line1(True), LineTime1(0830), LineColor1(DarkGray), Line2(True), LineTime2(1100), LineColor2(Red), Line3(True), LineTime3(1515), LineColor3(DarkGray); If Line1 and T >= LineTime1 and T[1] < LineTime1 then Plot11(c*2, "Line1", LineColor1) // set plot style as Histogram else Plot11(0); If Line2 and T >= LineTime2 and T[1] < LineTime2 then Plot12(c*2, "Line2", LineColor2) // set plot style as Histogram else Plot12(0); If Line3 and T >= LineTime3 and T[1] < LineTime3 then Plot13(c*2, "Line3", LineColor3) // set plot style as Histogram else Plot13(0);

Re: vertical line on chart  [SOLVED]

Posted: Apr 05 2021
by chipeur_le_renard
thx TJ

Re: vertical line on chart

Posted: Aug 26 2022
by pitrader
Is there a way to have these lines plot in advance rather than after the fact?

Re: vertical line on chart

Posted: Aug 27 2022
by TJ
Is there a way to have these lines plot in advance rather than after the fact?
You need to describe your vision with hard examples.
Please draw a diagram(s) to illustrate the operation.

Re: vertical line on chart

Posted: Aug 29 2022
by pitrader
The lines are only drawn after the data has passed. I need the lines to be there before the data. Pic #1 shows the way that it is now. Pic #2 is the way t hat I need it to be.

Re: vertical line on chart

Posted: Aug 29 2022
by TJ
The lines are only drawn after the data has passed. I need the lines to be there before the data. Pic #1 shows the way that it is now. Pic #2 is the way t hat I need it to be.
You need to describe your vision with hard examples.

What are those lines? Date/time lines?
What are the LOGIC of those line?
When do you want them plotted? Beginning of each day to plot the end of the day?

You need to describe your vision with DETAIL hard examples,
You need to describe your logic,
not just a bit of info here and there.
No one can read your mind.

Re: vertical line on chart

Posted: Aug 29 2022
by TJ
You can make the line with PLOT1[ -1 ] .