Data Window: Difference between revisions
From MultiCharts
No edit summary |
|||
| (One intermediate revision by one other user not shown) | |||
| Line 9: | Line 9: | ||
The indicator information will show the indicator names and values. | The indicator information will show the indicator names and values. | ||
== Displaying Data Window == | == Displaying Data Window == | ||
You can display the Data Window using one of the following methods: | |||
* Select '''View''' from the main menu, then select '''Show Data Window'''. | |||
* Press '''Ctrl + Shift + D'''. | |||
* Click the '''Show/Hide Data Window''' <img src="https://www.multicharts.com/trading-software/images/c/c6/Data_Window_Icon.png" width="24"> icon on the '''Chart Analysis''' toolbar. | |||
[[Category:Using Charts|H]] | [[Category:Using Charts|H]] | ||
Latest revision as of 17:19, 26 June 2024

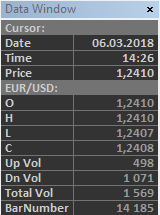
The Data Window displays information about a specific bar on the chart. When the user points the mouse pointer at a bar on the chart, the Data Window will automatically show data series information, strategy information, and indicator information.
The data series information will show the date and time stamp, price level of the mouse pointer, symbol name, open, high, low, close, up volume, down volume, and bar number.
The strategy information will show the direction of the signal, quantity, and the entry/exit price.
The indicator information will show the indicator names and values.
Displaying Data Window
You can display the Data Window using one of the following methods:
- Select View from the main menu, then select Show Data Window.
- Press Ctrl + Shift + D.
- Click the Show/Hide Data Window
 icon on the Chart Analysis toolbar.