Understanding Depth of Market (DOM): Difference between revisions
No edit summary |
|||
| (49 intermediate revisions by 3 users not shown) | |||
| Line 1: | Line 1: | ||
This industry-standard tool shows market depth, volume profile and provides one-click trading. MultiCharts’ DOM displays ten price levels each way and allows entry and exit automation directly in the DOM window. You can see volume at different prices to analyze how supply and demand are interacting and where prices may go. | |||
==Understanding DOM Window== | |||
Depth-of-Market window displays market depth, PnL, current positions as well as pending orders and provides one-click trading features. Entry and exit automation can be set up directly in the DOM window making it a unique and self-sufficient tool for manual trading (see [[Chart Trading Orders and Strategies]]). | Depth-of-Market window displays market depth, PnL, current positions as well as pending orders and provides one-click trading features. Entry and exit automation can be set up directly in the DOM window making it a unique and self-sufficient tool for manual trading (see [[Chart Trading Orders and Strategies]]). | ||
<img src="https://www.multicharts.com/trading-software/images/b/b7/DDDDD.png" width="750"> | |||
MultiCharts DOM displays up to 10 levels of market depth. 10 levels is the limit, if the broker provides less data, DOM displays fewer levels of market depth. | MultiCharts DOM displays up to 10 levels of market depth. 10 levels is the limit, if the broker provides less data, DOM displays fewer levels of market depth. | ||
Ask and Bid Size is shown in '''Buy''' and '''Sell''' columns respectively. | Ask and Bid Size is shown in '''Buy''' and '''Sell''' columns respectively. | ||
| Line 30: | Line 33: | ||
To enable Dynamic mode right-click anywhere on the DOM window except for '''Buy''', '''Price''' & '''Sell''' columns and control elements to see the shortcut menu and check '''Dynamic Price Scale'''. | To enable Dynamic mode right-click anywhere on the DOM window except for '''Buy''', '''Price''' & '''Sell''' columns and control elements to see the shortcut menu and check '''Dynamic Price Scale'''. | ||
<img src="https://www.multicharts.com/trading-software/images/8/83/DOM2.png" width="353"> | |||
If '''Dynamic Price Scale''' option is disabled, DOM operates in semi-static mode. | If '''Dynamic Price Scale''' option is disabled, DOM operates in semi-static mode. | ||
| Line 43: | Line 46: | ||
Open a new DOM window by one of following methods: | Open a new DOM window by one of following methods: | ||
* Click the '''New DOM Window''' icon <img src="https://www.multicharts.com/trading-software/images/8/8e/New_DOM_Window_200.png" width="24"> on the main toolbar | * Click the '''New DOM Window''' icon <img src="https://www.multicharts.com/trading-software/images/8/8e/New_DOM_Window_200.png" width="24"> on the main toolbar. | ||
* In the main menu select '''File''', then point to '''New''' and click '''DOM Window''' | * In the main menu select '''File''', then point to '''New''' and click '''DOM Window'''. | ||
* Use Ctrl+Alt+Ins keys combination on the keyboard. | * Use Ctrl+Alt+Ins keys combination on the keyboard. | ||
==Selecting Broker== | ==Selecting Broker== | ||
To select a broker, click on the arrow next to the '''Broker Connection''' button <img src="https://www.multicharts.com/trading-software/images/8/87/DOM3.png" width=" | To select a broker, click on the arrow next to the '''Broker Connection''' button <img src="https://www.multicharts.com/trading-software/images/8/87/DOM3.png" width="36"> and select a broker from the list. | ||
<div class="tip-no-title">For more info see [[Broker Profiles Overview]]</div> | <div class="tip-no-title">For more info see [[Broker Profiles Overview]].</div> | ||
==Connecting / Disconnecting Broker Profile== | ==Connecting / Disconnecting Broker Profile== | ||
When a broker is selected, click on the '''Broker Connection''' button <img src="https://www.multicharts.com/trading-software/images/8/87/DOM3.png" width=" | When a broker is selected, click on the '''Broker Connection''' button <img src="https://www.multicharts.com/trading-software/images/8/87/DOM3.png" width="36"> to connect/disconnect it. When MultiCharts is establishing the connection with the broker, the '''Broker Connection''' button is yellow. Once the connection is established, it becomes green. | ||
You can also right-click anywhere on the DOM window except for '''Buy''', '''Price''' & '''Sell''' columns and control elements to see the shortcut menu and click '''Connect / Disconnect Broker Profile'''. | You can also right-click anywhere on the DOM window except for '''Buy''', '''Price''' & '''Sell''' columns and control elements to see the shortcut menu and click '''Connect / Disconnect Broker Profile'''. | ||
<div class="tip-no-title">For more info see [[Broker Profiles Overview]]</div> | <div class="tip-no-title">For more info see [[Broker Profiles Overview]].</div> | ||
==Selecting Account== | ==Selecting Account== | ||
Select the account number in the '''Account Selector''' box <img src="https://www.multicharts.com/trading-software/images/7/72/DOM4.png" width=" | Select the account number in the '''Account Selector''' box <img src="https://www.multicharts.com/trading-software/images/7/72/DOM4.png" width="78"> | ||
==Selecting Instrument== | ==Selecting Instrument== | ||
To select the instrument you want to trade with: | To select the instrument you want to trade with: | ||
* Type in the symbol name into the '''Instrument Selector''' field and press Enter | * Type in the symbol name into the '''Instrument Selector''' field and press '''Enter'''. | ||
* Click on the '''Lookup''' button to select the necessary symbol from the database. | * Click on the '''Lookup''' button to select the necessary symbol from the database. | ||
| Line 74: | Line 77: | ||
==Volume Profile== | ==Volume Profile== | ||
<img src="https://www.multicharts.com/trading-software/images/1/15/Volume_Profile_in_DOM.png" width="601"> | |||
Volume Profile in DOM window allows discretionary traders to monitor changes in trade volume while making trading decisions live. | |||
To open the '''Volume Profile''' window right-click anywhere on the DOM window except for '''Buy''', '''Price''' & '''Sell''' columns and control elements to see the shortcut menu and check the '''Show Volume Profile''' option. | |||
To see '''PnL''' in the '''Volume Profile''' window right-click anywhere on the DOM window except for '''Buy''', '''Price''' & '''Sell''' columns and control elements to see the shortcut menu and check the '''Show PnL''' in Volume Profile panel. | To see '''PnL''' in the '''Volume Profile''' window right-click anywhere on the DOM window except for '''Buy''', '''Price''' & '''Sell''' columns and control elements to see the shortcut menu and check the '''Show PnL''' in Volume Profile panel. | ||
| Line 92: | Line 97: | ||
Profit and Loss can be indicated in: | Profit and Loss can be indicated in: | ||
dollars | dollars <img src="https://www.multicharts.com/trading-software/images/d/d4/DOM5.png" width="74">, ticks <img src="https://www.multicharts.com/trading-software/images/9/95/DOM6.png" width="74"> and percent <img src="https://www.multicharts.com/trading-software/images/3/3a/DOM7.png" width="74">. | ||
To change indication type, click on '''PnL and Current position''' box. | To change indication type, click on '''PnL and Current position''' box. | ||
'''AvgEntry Price''' of the position is highlighted in | '''AvgEntry Price''' of the position is highlighted in blue for a long position in the Price column. | ||
<img src="https://www.multicharts.com/trading-software/images/8/87/AvgEntry_Long.png" width="351"> | |||
In red – for a short position in the Price column. | |||
<img src="https://www.multicharts.com/trading-software/images/1/17/AvgEntry_Short.png" width="351"> | |||
==One-Click Order Placing== | ==One-Click Order Placing== | ||
| Line 104: | Line 113: | ||
DOM window allows you to place Market, Stop, Limit and Stop-Limit orders with just one click. | DOM window allows you to place Market, Stop, Limit and Stop-Limit orders with just one click. | ||
<div class="tip-no-title">For more info about DOM trading see [[DOM Trading|this page]].</div> | |||
<div class=" | |||
==Resizing DOM== | ==Resizing DOM== | ||
| Line 336: | Line 123: | ||
Extended mode stretches DOM from top to bottom of your screen, and Compact mode shows a more compact trade panel. | Extended mode stretches DOM from top to bottom of your screen, and Compact mode shows a more compact trade panel. | ||
To switch between Compact and Extended Mode in Depth Of Market window: | To switch between '''Compact''' and '''Extended Mode''' in Depth Of Market window: | ||
* Right click on any free space of the DOM window and click Switch To Compact/Full Mode | * Right click on any free space of the DOM window and click '''Switch To Compact/Full Mode'''. | ||
* Click the Switch To Compact/Full Mode button <img src="https://www.multicharts.com/trading-software/images/7/73/Switch_To_Compact_Mode.png" width=" | * Click the '''Switch To Compact/Full Mode''' button <img src="https://www.multicharts.com/trading-software/images/7/73/Switch_To_Compact_Mode.png" width="12">. | ||
==Always Show Entire Number | ==Always Show Entire Number Option== | ||
Always Show Entire Number feature affects the type of volume numbers indication. | Always Show Entire Number feature affects the type of volume numbers indication. | ||
| Line 372: | Line 159: | ||
|} | |} | ||
To enable/disable Always Show Entire Number feature, right-click anywhere on the DOM window except for Buy, Price & Sell columns and control elements to see the shortcut menu, then check/uncheck Always Show Entire Number feature. | To enable/disable Always Show Entire Number feature, right-click anywhere on the DOM window except for '''Buy''', '''Price''' & '''Sell''' columns and control elements to see the shortcut menu, then check/uncheck '''Always Show Entire Number''' feature. | ||
==How to Change Font Size== | ==How to Change Font Size== | ||
Font settings can be easily customized in '''Select Font''' menu. Right-click anywhere on the DOM window except for Buy, Price & Sell columns and control elements to see the shortcut menu and click '''Select Font'''. | Font settings can be easily customized in '''Select Font''' menu. Right-click anywhere on the DOM window except for '''Buy''', '''Price''' & '''Sell''' columns and control elements to see the shortcut menu and click '''Select Font'''. | ||
==Default Order Colors== | ==Default Order Colors== | ||
| Line 455: | Line 242: | ||
==How to Customize DOM Colors== | ==How to Customize DOM Colors== | ||
Right-click anywhere on the DOM window except for Buy, Price & Sell columns and control elements to see the shortcut menu and select '''Format Colors''', then click on the color to customize it. | Right-click anywhere on the DOM window except for '''Buy''', '''Price''' & '''Sell''' columns and control elements to see the shortcut menu and select '''Format Colors''', then click on the color to customize it. | ||
Select one of the standard 40 colors from the palette box, or click the Other button to choose custom colors. | Select one of the standard 40 colors from the palette box, or click the '''Other''' button to choose custom colors. | ||
==DOM | ==DOM Service Window== | ||
DOM can be opened as a service window that can be attached to any side of the main MultiCharts window. It has exactly the same functionality as the regular DOM window and is visible on all workspaces when open. | DOM can be opened as a service window that can be attached to any side of the main MultiCharts window. It has exactly the same functionality as the regular DOM window and is visible on all workspaces when open. | ||
| Line 465: | Line 252: | ||
To open DOM as a service window go to '''View''' → '''Show DOM window'''. | To open DOM as a service window go to '''View''' → '''Show DOM window'''. | ||
[[Category: | [[Category:Depth of Market (DOM)|A]] | ||
Latest revision as of 13:13, 3 October 2024
This industry-standard tool shows market depth, volume profile and provides one-click trading. MultiCharts’ DOM displays ten price levels each way and allows entry and exit automation directly in the DOM window. You can see volume at different prices to analyze how supply and demand are interacting and where prices may go.
Understanding DOM Window
Depth-of-Market window displays market depth, PnL, current positions as well as pending orders and provides one-click trading features. Entry and exit automation can be set up directly in the DOM window making it a unique and self-sufficient tool for manual trading (see Chart Trading Orders and Strategies).
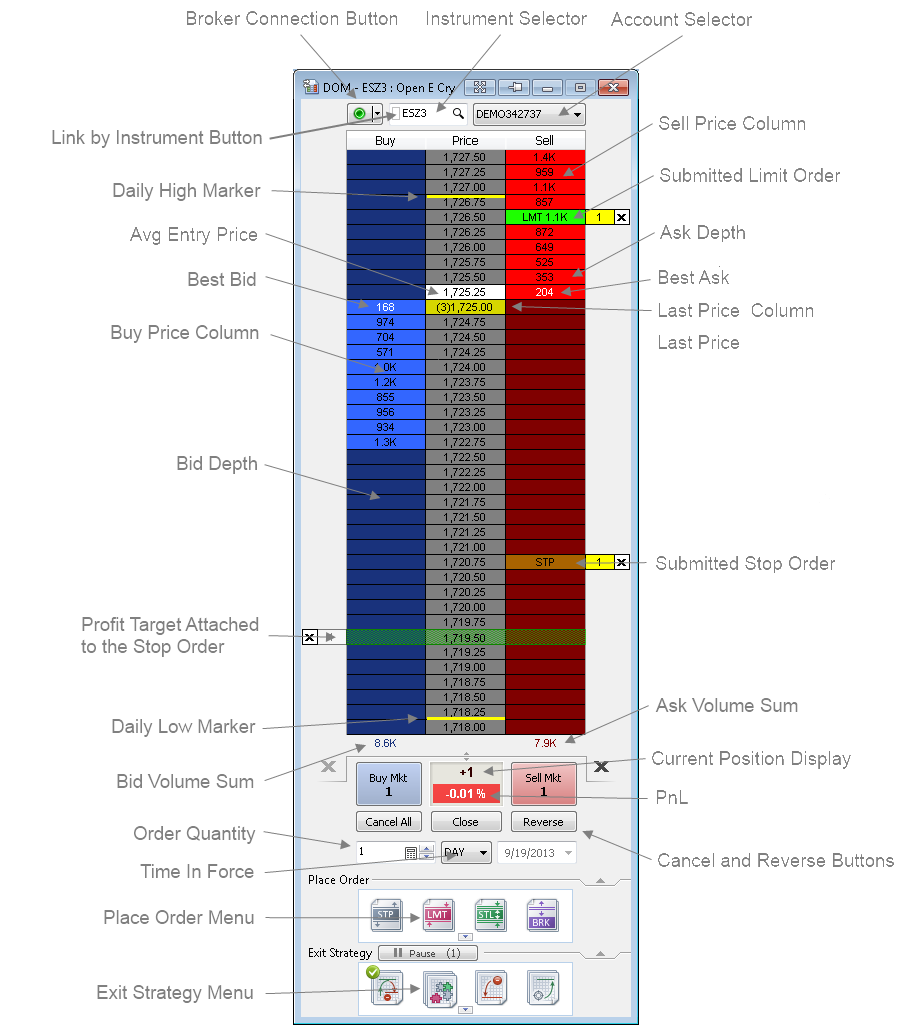
MultiCharts DOM displays up to 10 levels of market depth. 10 levels is the limit, if the broker provides less data, DOM displays fewer levels of market depth.
Ask and Bid Size is shown in Buy and Sell columns respectively.
Best Bid and Best Ask are marked with white color. Last trade price and size are highlighted in yellow in Price column. Day High/Low prices are marked with yellow lines. Those are default colors that can be changed.
Bid and Ask Volume Sum
Bid and Ask volume sum is calculated summing up the volumes of Bid and Ask respectively and each is shown under Bid and Ask columns. This option is enabled by default and can be disabled if you right-click anywhere on the DOM window except for Buy, Price & Sell columns and control elements to see the shortcut menu and uncheck Bid/Ask Sum option. Bid/Ask Sum option is shown either in Compact Mode, or in Full Mode of the DOM Window.
Day High and Low Options
Day High and Low green and yellow (by default and can be changed) marker lines are located on the upper and bottom of the corresponding price boxes of the middle grey price column, and indicate High and Low prices of the day. This option is enabled by default and can be disabled if you right-click anywhere on the DOM window except for Buy, Price & Sell columns and control elements to see the shortcut menu and uncheck Day High/Low option. Day High/Low option is shown either in Compact Mode, or in Full Mode of the DOM Window.
Dynamic and Semi-Static Modes
MultiCharts DOM has two modes: dynamic and semi-static.
Dynamic DOM mode means the DOM window will automatically re-center after each new tick (price update) received. This mode is very useful for scalping strategies.
To enable Dynamic mode right-click anywhere on the DOM window except for Buy, Price & Sell columns and control elements to see the shortcut menu and check Dynamic Price Scale.
If Dynamic Price Scale option is disabled, DOM operates in semi-static mode.
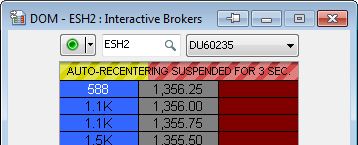
Semi-static DOM mode means the DOM window will re-center once the current price hits the upper or lower boundary of the window. A 5 second countdown precedes re-centering.
Static DOM has been patented by Trading Technologies: absolutely static DOM, no auto-recentering. MultiCharts DOM is semi-static meaning that it will move without input from the user (i.e. if the price goes off the screen), which creates the possibility of making an error during input. It was implemented this way in order not to violate the patent.
Regardless of the DOM mode that is selected, to center last trade price double click on the Price column.
Creating New DOM Window
Open a new DOM window by one of following methods:
- Click the New DOM Window icon
 on the main toolbar.
 - In the main menu select File, then point to New and click DOM Window.
- Use Ctrl+Alt+Ins keys combination on the keyboard.
Selecting Broker
To select a broker, click on the arrow next to the Broker Connection button ![]() and select a broker from the list.
and select a broker from the list.
Connecting / Disconnecting Broker Profile
When a broker is selected, click on the Broker Connection button ![]() to connect/disconnect it. When MultiCharts is establishing the connection with the broker, the Broker Connection button is yellow. Once the connection is established, it becomes green.
to connect/disconnect it. When MultiCharts is establishing the connection with the broker, the Broker Connection button is yellow. Once the connection is established, it becomes green.
You can also right-click anywhere on the DOM window except for Buy, Price & Sell columns and control elements to see the shortcut menu and click Connect / Disconnect Broker Profile.
Selecting Account
Select the account number in the Account Selector box 
Selecting Instrument
To select the instrument you want to trade with:
- Type in the symbol name into the Instrument Selector field and press Enter.
- Click on the Lookup button to select the necessary symbol from the database.
Volume Profile
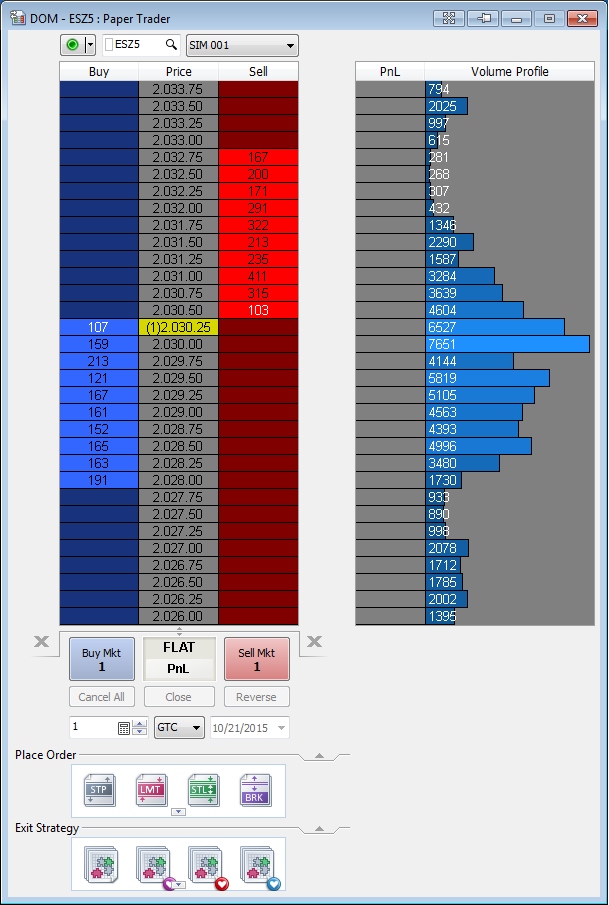
Volume Profile in DOM window allows discretionary traders to monitor changes in trade volume while making trading decisions live.
To open the Volume Profile window right-click anywhere on the DOM window except for Buy, Price & Sell columns and control elements to see the shortcut menu and check the Show Volume Profile option.
To see PnL in the Volume Profile window right-click anywhere on the DOM window except for Buy, Price & Sell columns and control elements to see the shortcut menu and check the Show PnL in Volume Profile panel.
Linking DOM by Instrument
When the instrument for any one DOM window or chart of the linked group is changed, the changes will automatically be applied to the rest of the linked charts/DOM Windows:
- To link a DOM window by symbol, click the Instrument Link button.
- To assign the series to a Link Group, select the Link Group Color Code from the drop-down list.
- To un-link the series, select Not Linked.
PnL and Current Position
PnL and Current Position box indicates Current Position and Profit and Loss. Positive value (profit) is colored green, negative value (loss) is colored red.
Profit and Loss can be indicated in:
dollars  , ticks
  and percent
  .
.
To change indication type, click on PnL and Current position box.
AvgEntry Price of the position is highlighted in blue for a long position in the Price column.

In red – for a short position in the Price column.

One-Click Order Placing
DOM window allows you to place Market, Stop, Limit and Stop-Limit orders with just one click.
Resizing DOM
DOM window height can be customized. To resize the whole DOM window or change the depth, drag the bottom of the scale.
Compact Mode and Extended Mode
Extended mode stretches DOM from top to bottom of your screen, and Compact mode shows a more compact trade panel.
To switch between Compact and Extended Mode in Depth Of Market window:
- Right click on any free space of the DOM window and click Switch To Compact/Full Mode.
- Click the Switch To Compact/Full Mode button
 .
.
Always Show Entire Number Option
Always Show Entire Number feature affects the type of volume numbers indication.
When Always Show Entire Number feature is enabled, volume quantity in Bid and Ask price scales will be indicated as is, i.e. full-length.
When Always Show Entire Number feature is disabled, and volume quantity in Bid and Ask price scales is more than 999, the quantity will be indicated rounded or abbreviated.
Example
| Quantity | Always Show Entire Number ON | Always Show Entire Number OFF |
|---|---|---|
| 33,000 | 33,000 | 33K |
| 25,700,000 | 25,700,000 | 25.7M |
| 25,700,001 | 25,700,001 | 25.7M |
| 25,763,275 | 25,763,275 | 25.8M |
To enable/disable Always Show Entire Number feature, right-click anywhere on the DOM window except for Buy, Price & Sell columns and control elements to see the shortcut menu, then check/uncheck Always Show Entire Number feature.
How to Change Font Size
Font settings can be easily customized in Select Font menu. Right-click anywhere on the DOM window except for Buy, Price & Sell columns and control elements to see the shortcut menu and click Select Font.
Default Order Colors
| Order/Strategy | Color | Red | Green | Blue |
|---|---|---|---|---|
| Breakeven Strategy | Yellow | 255 | 255 | 0 |
| Breakout Down/Fade Strategy | Dark Cyan | 0 | 139 | 139 |
| Breakout Strategy | Medium Purple | 147 | 112 | 219 |
| Breakout Up/Fade Strategy | Sienna | 160 | 82 | 45 |
| Fade Strategy | Olive Drab | 107 | 142 | 35 |
| Limit Order | Green | 0 | 255 | 0 |
| Stop Limit Order | Magenta | 255 | 0 | 255 |
| Stop Loss Order | Red | 255 | 0 | 0 |
| Stop Order | Sienna | 160 | 82 | 45 |
| Profit Target Strategy | Lime Green | 50 | 205 | 50 |
| Trailing Stop Strategy | Orange | 255 | 165 | 0 |
How to Customize DOM Colors
Right-click anywhere on the DOM window except for Buy, Price & Sell columns and control elements to see the shortcut menu and select Format Colors, then click on the color to customize it.
Select one of the standard 40 colors from the palette box, or click the Other button to choose custom colors.
DOM Service Window
DOM can be opened as a service window that can be attached to any side of the main MultiCharts window. It has exactly the same functionality as the regular DOM window and is visible on all workspaces when open.
To open DOM as a service window go to View → Show DOM window.